



Bitcoin [BTC], the largest cryptocurrency by market capitalization at $1.35 trillion, has moved through one of the most unprofitable stretches in its history. Notably, BTC’s slump has now extended across three separate quarters and two calendar years.
That performance has broken away from the equities market over the same window, leaving a wide band of investors holding positions below their entry price. One relationship has held through the divergence, that of the $4.8 trillion technology giant Apple [AAPL].
Bitcoin-AAPL ratio could frame the next cycle
A chart from Alphractal plotting Bitcoin against AAPL shares has surfaced a correlation that traders can use to map where both assets sit in their respective cycles. The ratio has traded inside an ascending channel that stretches back to 2017, giving the structure close to a decade of price history to lean on.
Parallel ascending support and resistance lines define that channel, with the lower boundary historically marking undervaluation for Bitcoin and the upper boundary marking overvalued territory.

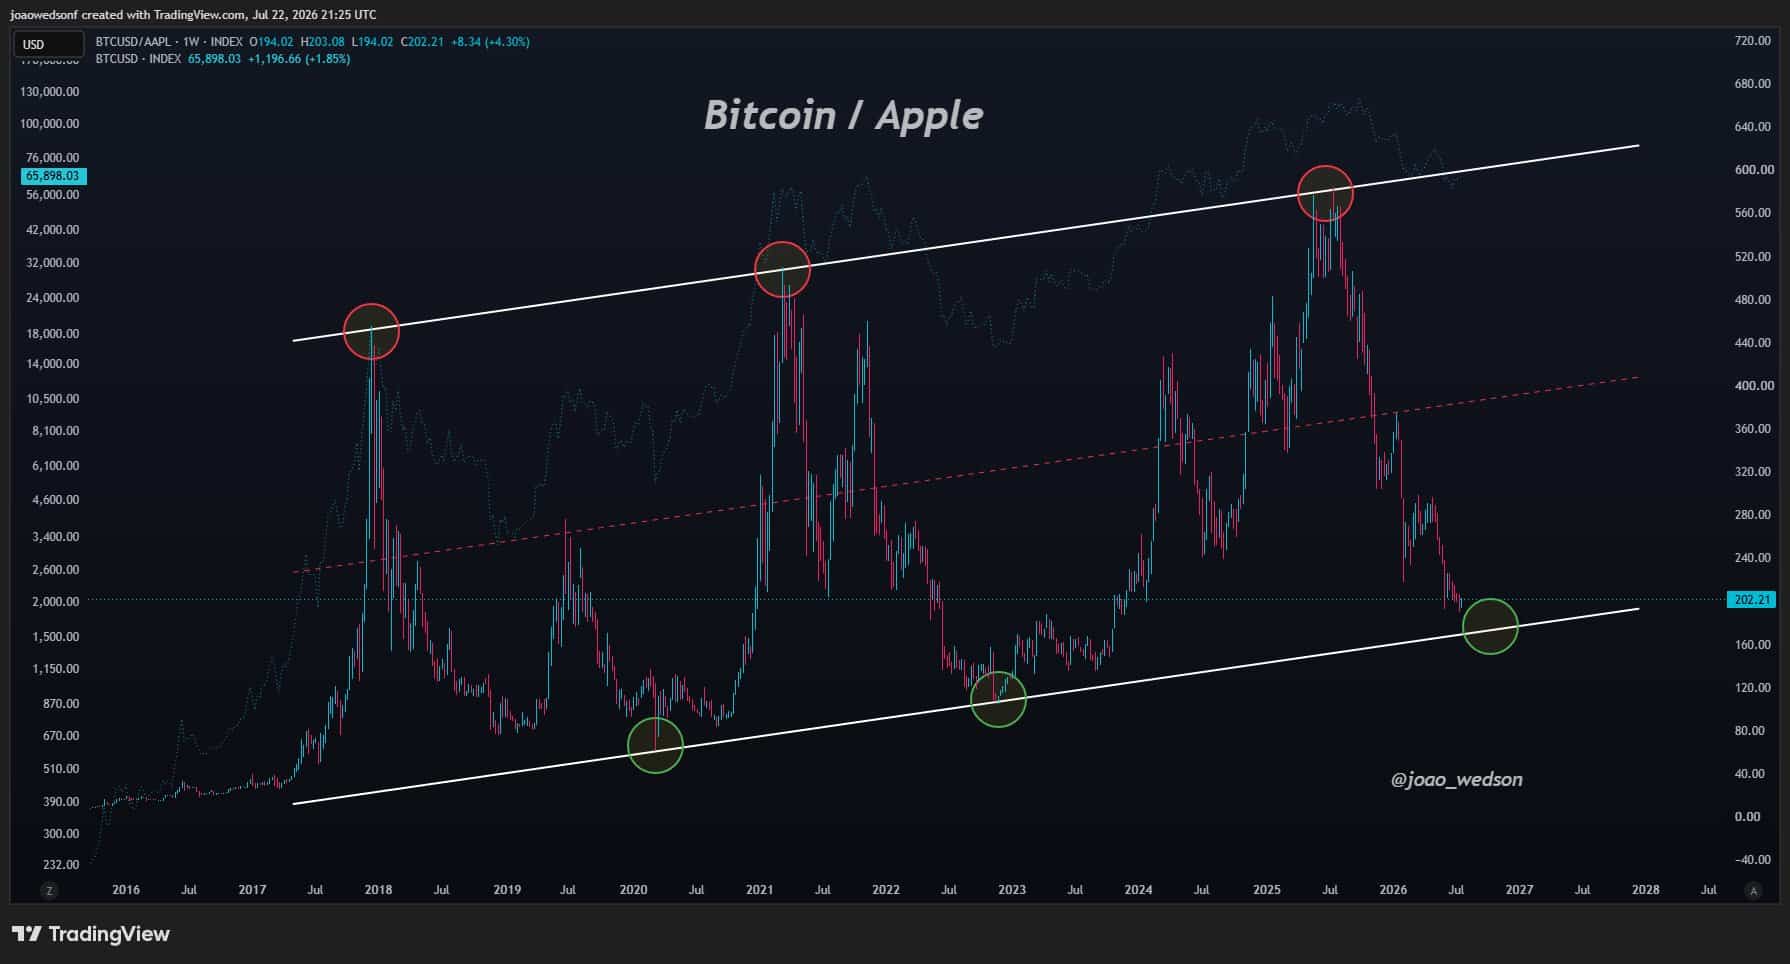
Every long-term Bitcoin cycle over that period has respected those boundaries, and the Alphractal data places the ratio close to the support line once again, with the remaining gap now narrow.
A move into that region, should it play out as it has in previous instances, would put Bitcoin back in the accumulation zone that preceded each of its earlier expansion phases.
Bitcoin-S&P correlation breaks!
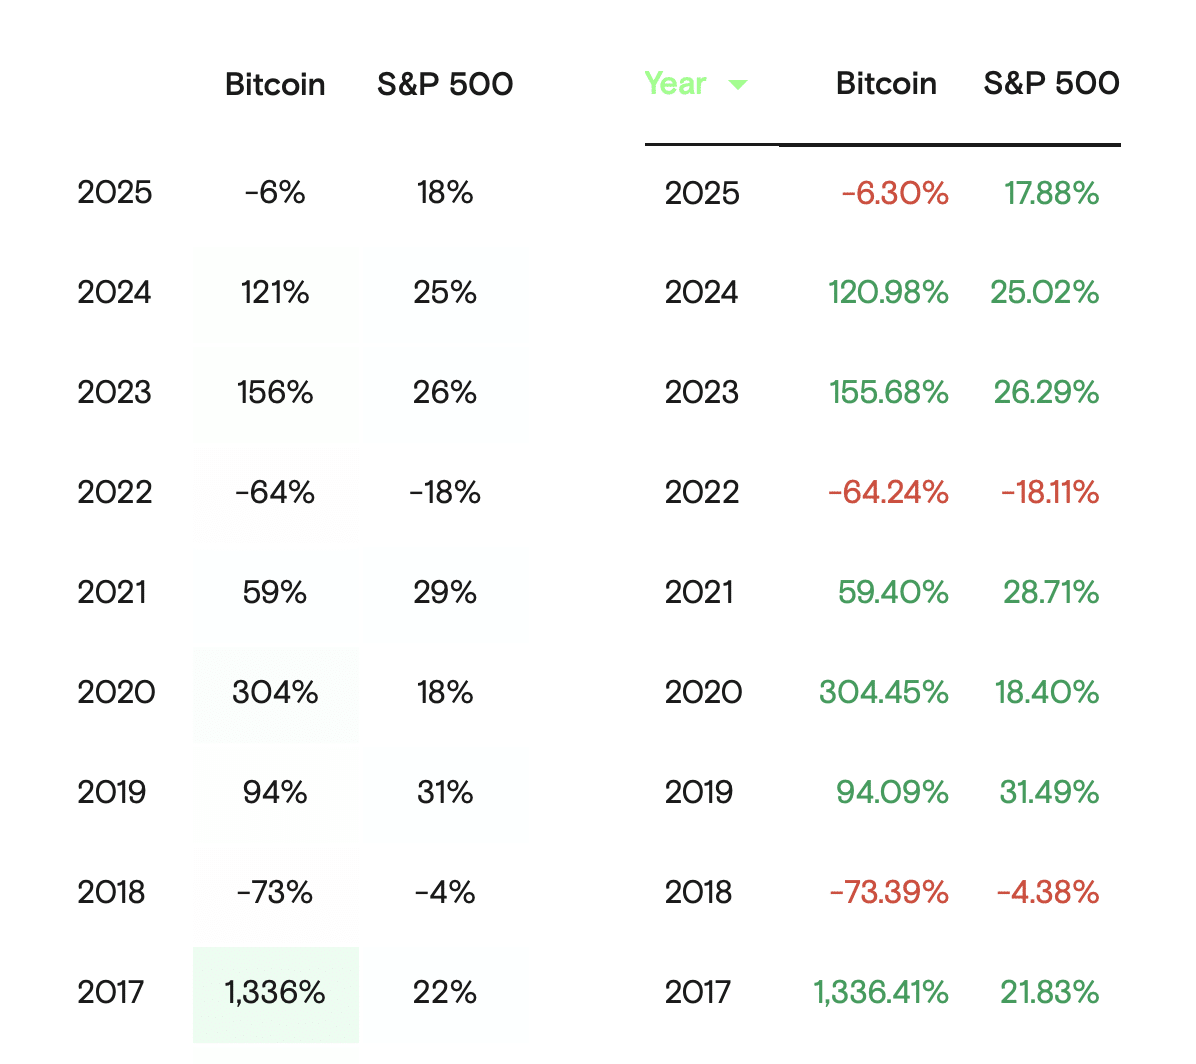
Bitcoin and the equities market, represented here by the S&P 500, have tracked each other on an annual basis since 2017, with 2025 standing as the single break in an otherwise consistent pattern.
The relationship shows up most clearly in annual returns, where a positive year for Bitcoin has coincided with a positive year for the S&P 500, and the reverse has held as well, with Bitcoin delivering the larger move in either direction.
However, that pattern broke in 2025, when Bitcoin closed the year down 6% against an 18% gain for the S&P 500. Roughly $1 trillion left Bitcoin’s market capitalization between October and December of that year alone.
The Nasdaq 100 returns the same result, placing the break across the broader equities complex.
Bitcoin’s sharper reaction to a sequence of macro shocks accounts for the gap, including the October 10 liquidation event, the tariff dispute with China, and the U.S.-Israel-Iran conflict. This pushes investors out of risk assets and into safer alternatives.
Those events sit outside the eight years of alignment that came before them, which leaves the longer structure and the channel the Bitcoin-AAPL ratio still trades within intact.
On-chain signal to watch
The Bitcoin-AAPL relationship gives traders a way to anticipate a rally, while on-chain data offers the confirmation needed to time one.
Dry powder in the form of stablecoins ranks among the more reliable indicators here, since stablecoin flows onto exchanges signal capital rotating back into the crypto market ahead of an expansion. Moreover, Bitcoin has captured the largest share of those inflows in past cycles.
Notably, DeFiLlama data shows $1.42 billion in stablecoins moving into the market over the last seven days, a figure that sits well below the level associated with previous rallies. It falls short against the more than $10 billion withdrawn across the past thirty days.
Final Summary
- The Bitcoin-AAPL ratio has traded inside an ascending channel since 2017.
- Stablecoin inflows of $1.42 billion over seven days sit well under the $10 billion pulled from the market across 30 days.






Be the first to comment