


Bitcoin price remained under pressure on Monday as weakening technical indicators, heavy ETF outflows, and rising geopolitical tensions continued weighing on investor sentiment, with traders increasingly watching whether BTC could revisit the key $75,000 support zone next.
Summary
- Bitcoin price slipped toward the $76,000 region as bearish SMA crossover signals and weakening RSI momentum increased downside pressure on BTC.
- Spot Bitcoin ETFs recorded over $1 billion in recent net outflows, while short-term holders realized losses on more than 15,000 BTC.
- Analysts identified key Bitcoin support near $75,733, with CoinGlass liquidation data showing dense leverage clusters around the $75,500 zone.
According to data from crypto.news, Bitcoin (BTC) traded around $76,700 at press time on May 19 after briefly attempting to stabilize above the $77,000 region earlier in the day. The asset has now lost momentum following its recent rejection near the $83,000 area, where a large amount of leveraged long exposure had previously accumulated.

One of the biggest catalysts behind the latest risk-off move has been renewed geopolitical uncertainty surrounding Iran. Reports that U.S. and Israeli officials recently discussed potential military action against Tehran triggered a sharp deterioration in global market sentiment, sending investors away from speculative assets.
Unlike traditional markets that close on weekends, Bitcoin trades continuously, often making it the first major asset sold during sudden panic-driven events. That dynamic intensified volatility over the past several sessions as traders rushed to reduce leveraged exposure across crypto markets.
Institutional positioning has also weakened notably. U.S.-listed spot Bitcoin ETFs have recently recorded more than $1 billion in cumulative net outflows, signaling that institutional demand has cooled significantly after months of aggressive accumulation earlier this year.
On-chain data further shows that short-term holders have increasingly exited positions at a loss. Analysts noted that more than 15,000 BTC tied to short-term investors were recently sold below cost basis, a sign that panic selling has started accelerating near current levels.
Macro conditions have simultaneously become less favorable for risk assets. Elevated crude oil prices have strengthened inflation concerns across global markets, reducing expectations that the Federal Reserve will begin cutting interest rates anytime soon.
Investors are now closely monitoring this week’s Federal Open Market Committee minutes alongside upcoming speeches from Federal Reserve officials, including Governor Christopher Waller, for additional clues regarding future monetary policy direction.
The latest weekly U.S. initial jobless claims data scheduled for Thursday could also influence short-term crypto sentiment. A stronger labor market would likely reinforce the Federal Reserve’s higher-for-longer rate stance, which has historically pressured non-yielding assets such as Bitcoin.
Some analysts, however, believe Bitcoin may still attempt a short-term rebound before determining its next broader direction.
“BTC tapped the $75,000-$76,000 support zone and is now bouncing back. There’s a CME gap at $79,200 level which might get filled next,” analyst Ted Pillows said.
Meanwhile, Ali Martinez said traders are closely monitoring several major Bitcoin price levels as volatility continues increasing across the market. According to Martinez, immediate resistance stands near $78,258, followed by a stronger barrier around $84,569, while key support levels sit at approximately $75,733 and $66,898.
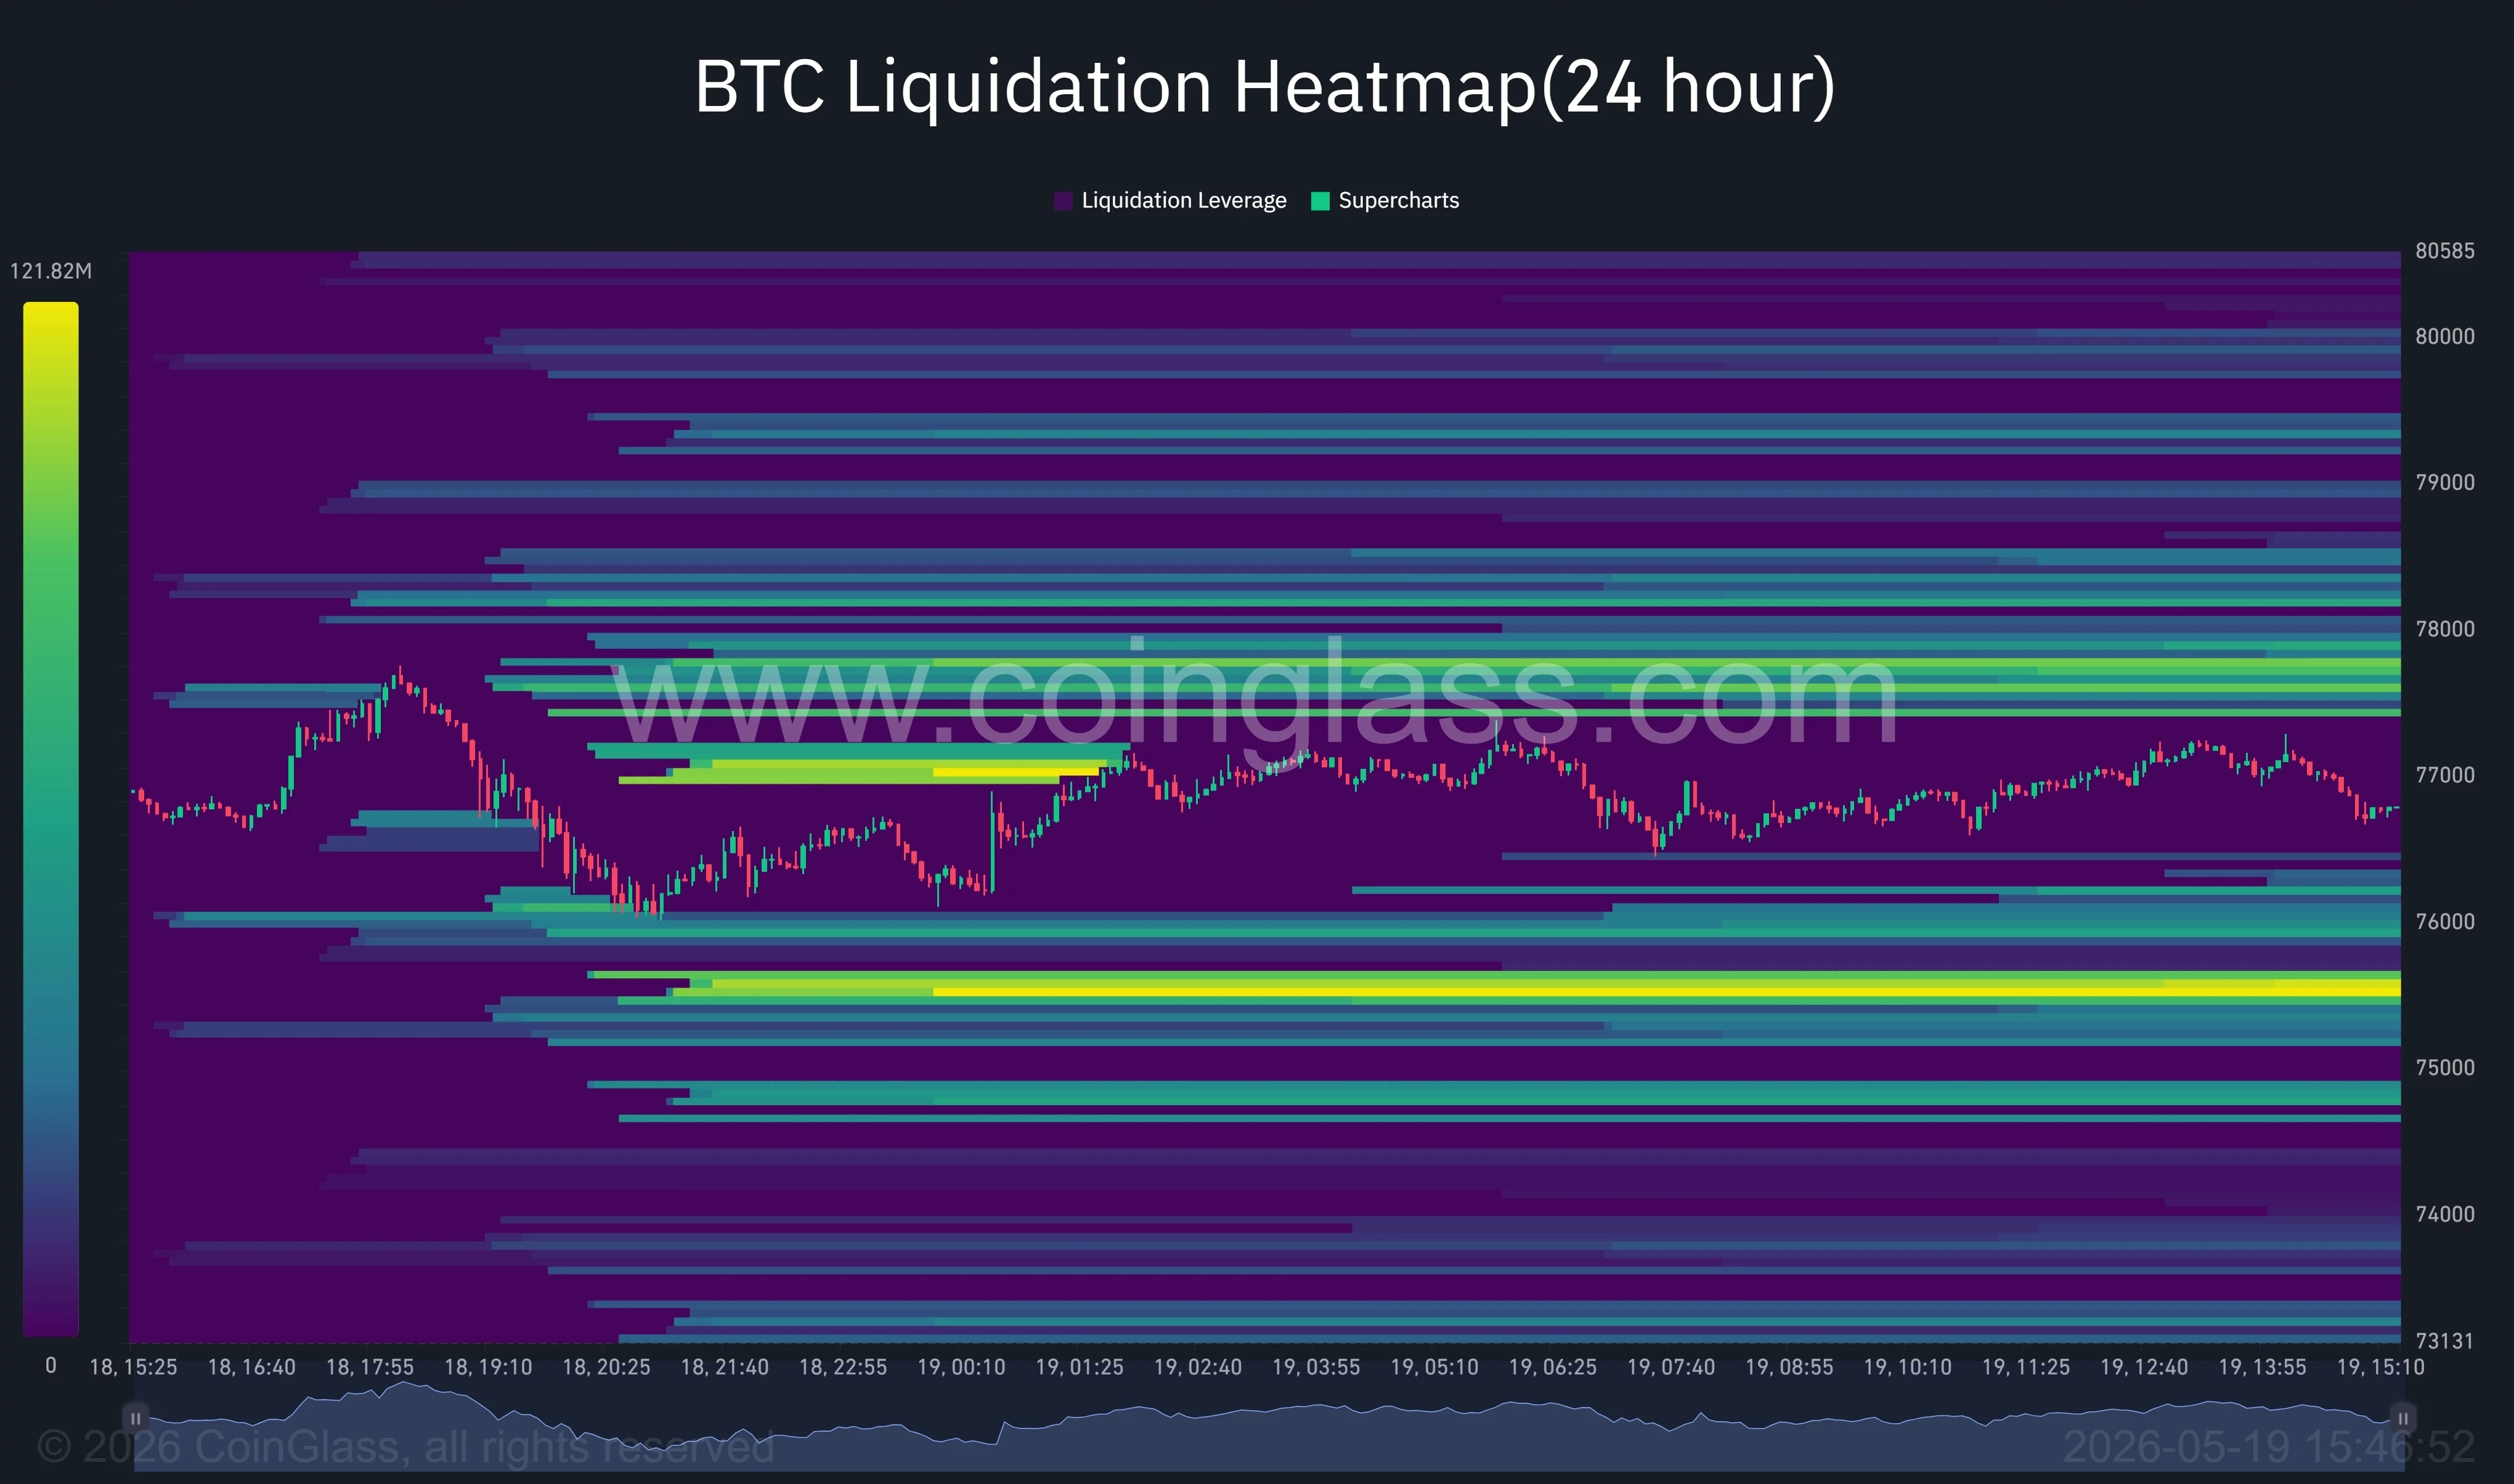
Derivatives data suggests leveraged positioning continues playing a major role in short-term price action. CoinGlass liquidation heatmap data shows dense liquidity clusters concentrated around both the $78,000 region and the lower $75,500 area, indicating that price may continue gravitating toward heavily leveraged zones.
The heatmap additionally reveals that a substantial amount of long leverage previously built near the $83,000 area has already been flushed from the market. Such liquidation cascades often amplify downside volatility because forced selling accelerates price declines beyond organic spot demand weakness.
Why are traders worried about the bearish SMA crossover?
On the daily chart, Bitcoin recently broke below a rising trendline support that had guided the market higher since early April, weakening the broader higher-low structure that bulls had defended for weeks.
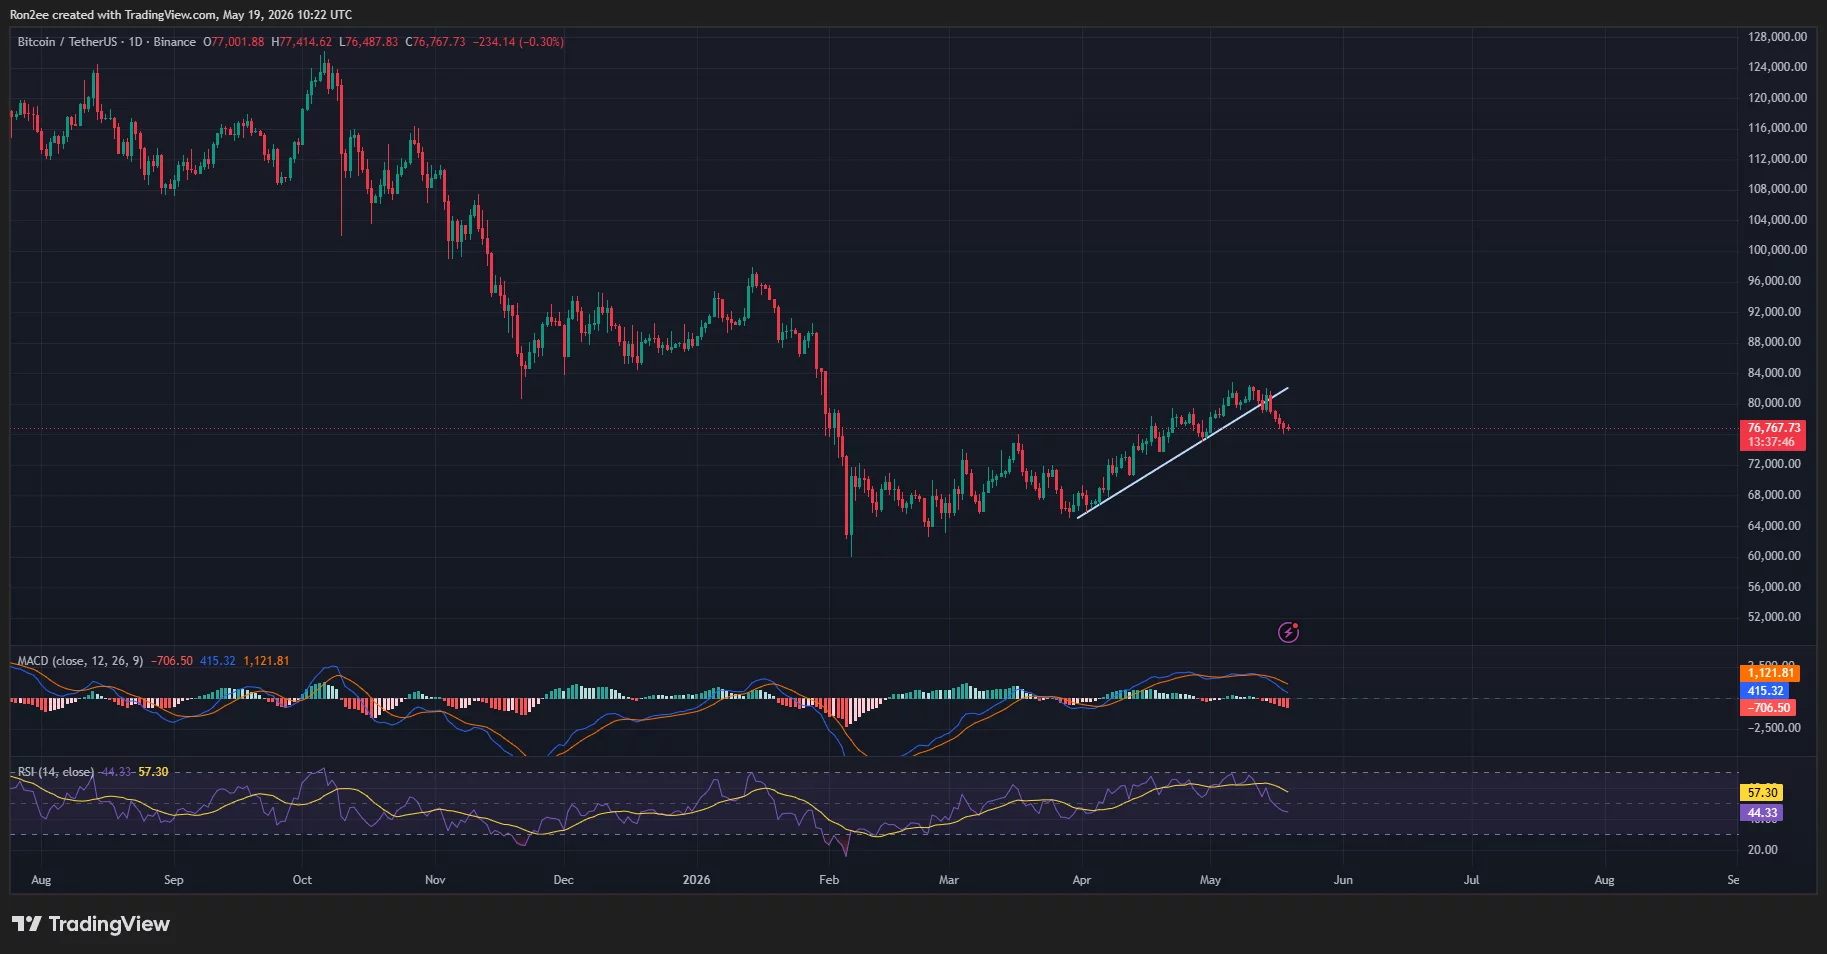
At the same time, the 20-day simple moving average is now approaching a bearish crossover below the 50-day SMA. Traders often interpret this setup as an early sign that short-term momentum is beginning to shift in favor of sellers.
Unlike isolated price volatility, moving average crossovers tend to reflect broader changes in trend strength because they smooth out short-term market noise. That is why traders closely monitor these formations during periods of increased uncertainty.
Bitcoin is also starting to lose support from medium-term moving averages that previously acted as dynamic support during the April rebound rally. Failure to reclaim those levels quickly could encourage additional downside positioning from momentum traders.
Momentum indicators have similarly deteriorated over recent sessions. The MACD indicator has now crossed deeper into bearish territory, with the MACD line remaining below the signal line while the histogram continues printing expanding red bars. This setup typically signals that downside momentum remains dominant rather than stabilizing.
Meanwhile, the Relative Strength Index has turned sharply lower after previously approaching overbought territory earlier this month. The RSI now sits near neutral levels, suggesting bullish momentum has faded considerably without yet reaching deeply oversold conditions.
That distinction remains important because an oversold RSI often signals that sellers may be nearing exhaustion. Bitcoin’s current RSI structure instead suggests the market could still have room for additional downside before a stronger relief bounce emerges.
Could liquidation pressure drag Bitcoin toward $75K?
Liquidation positioning continues pointing to heightened volatility around current price levels. CoinGlass heatmap data shows one of the largest nearby liquidity pockets sitting around the $75,500 region, which closely aligns with Bitcoin’s broader historical neckline support between roughly $74,000 and $75,000.
When large concentrations of leveraged positions accumulate near key technical levels, price frequently gravitates toward those zones as stop-loss orders and forced liquidations begin triggering automatically.
That dynamic becomes especially important in crypto markets because perpetual futures traders often use significantly higher leverage compared to traditional financial markets.
If Bitcoin loses the current support region decisively, forced long liquidations could accelerate mechanically and drag the asset toward the next major liquidity pocket near the mid-$75,000 area.
At the same time, bulls may still attempt a short-term recovery if Bitcoin manages to reclaim the $78,000–$79,000 region where another large concentration of liquidity currently sits.
The CME gap near $79,200 highlighted by Ted Pillows also increases the probability of a temporary rebound attempt because Bitcoin has historically shown a tendency to revisit unfilled futures gaps.
Broader market sentiment, however, remains fragile. Altcoins have largely underperformed Bitcoin throughout the latest sell-off, signaling that speculative appetite across the crypto sector continues deteriorating.
The recent ETF outflow trend further reinforces that caution. Spot Bitcoin ETFs previously acted as one of the market’s strongest sources of structural spot demand earlier this year, meaning persistent outflows now remove a key layer of buying support during corrections.
Still, some analysts continue viewing the current decline as part of a broader consolidation phase rather than the beginning of a full bear market cycle.
Ali Martinez’s major support level near $66,898 remains a key longer-term defense zone that many traders may aggressively monitor if the current neckline support eventually fails.
For now, however, Bitcoin’s short-term structure remains tilted toward the downside.
If BTC fails to reclaim the $78,258 resistance identified by Martinez, bears could increasingly target the key $75,000 support region next. A confirmed breakdown below that zone may then expose Bitcoin to a deeper correction toward the $67,000 area, where the next major support cluster currently sits.
Disclosure: This article does not represent investment advice. The content and materials featured on this page are for educational purposes only.

Be the first to comment