



Ondo (ONDO) trades at around $0.4141 on September 19, 2026. That is 61.6 percent below the twelve-month high of $1.0788, set exactly a year ago, and at the same time 84.3 percent above the twelve-month low of $0.2247 from February 6, 2026. Over the past week the token has gained 17.6 percent and has returned to 40th place by market capitalization. The question that follows is the only one investors really care about: is Ondo a good buy at the current price?
The price data in this article was collected by cryptoticker.io itself on September 19, 2026. The market data source is CoinMarketCap; 365 daily closing prices up to September 18, 2026 were evaluated, together with the live price on the day of collection. The moving averages are calculated exponentially (EMA), the relative strength index using the standard 14-day formula. All percentages refer to this series.
Ondo price analysis: where the ONDO price actually stands today
Three markers frame the Ondo price. The first is the 200-day line at $0.3757. Ondo trades 10.2 percent above it. The second is the 50-day line at $0.3589, which sits 15.4 percent below the price. The third is the zone around $0.45 to $0.48, where the price failed in spring and again in summer 2026.
That produces an uncomfortable position for buyers: Ondo stands above both averages and is therefore technically in upward territory, but directly below a resistance level that has already held twice. The next reliable support does not sit just underneath, but only at the 50-day line, around 13 percent lower. Anyone buying today is buying into a narrow corridor.

Over one year the balance remains negative: minus 61.6 percent. Over 90 days there is a gain of 20.8 percent, over 30 days one of 19.3 percent. The recovery is therefore young and has so far only slowed the annual loss. How these markers fit into the longer picture is set out in our Ondo price prediction.
Is the Ondo downtrend broken or merely interrupted
A downtrend counts as broken when the price ends a series of lower highs and not only touches the 200-day line but holds it. The first part is met: the February 2026 low at $0.2247 has not been undercut since, and the interim lows in June and August were each higher. The second part is not yet fully met. Ondo only reclaimed the 200-day line in late summer, and the line itself is still edging lower.
This combination is typical of an early bottoming process, but it is not proof of one. In our view the structure argues for an interruption of the downtrend rather than its end, because the decisive confirmation is missing: a weekly close above $0.48. That is an assessment, not a statement of fact.
What the RSI and moving averages mean for an Ondo entry
The relative strength index stands at 64.0. It is the most interesting figure in this analysis, because it signals neither buying panic nor a sell-off. Overbought conventionally begins at 70, oversold ends at 30. Ondo sits between the two, but clearly in the upper half. For an entry that means two things.
First, the cheap moment has passed: anyone who bought Ondo near the twelve-month low of $0.2247 in February 2026 is sitting on a gain of 84 percent. Second, the price is not yet overstretched. An RSI of 64.0 leaves room before the usual profit-taking sets in.
The order of the averages supports this. The 50-day line at $0.3589 sits below the price, but still below the 200-day line at $0.3757. The two lines have therefore not yet crossed. As long as that remains the case, the upward move is not technically confirmed. In practice this means the 50-day line is the marker at which an entry proves right or wrong.
What trading volume reveals about demand for Ondo
This is where the most striking figure of the analysis sits. Over the past 24 hours, Ondo worth around $251 million was traded. That equals 12.4 percent of the market capitalization of $2.02 billion and is a high reading for a token of this size.
On a seven-day average the volume is around $115 million, on a 30-day average $131 million. The median of the past twelve months is $80 million. The current week is therefore around 43 percent above the annual median, while the seven-day figure is 12.6 percent below the 30-day figure.
The picture is mixed. The price rise of the past week is carried by real turnover rather than by thin order books. At the same time, the decline against the monthly average shows that demand arrives in bursts. Whether that becomes a trend will be decided in the coming weeks.
Which structural factors speak for Ondo: supply, usage, regulation
Ondo belongs to the group of protocols for tokenized real-world assets and represents short-dated government bonds and money market products on the blockchain. The technical descriptions are set out in the project’s public documentation. The ONDO token is a governance token and not a share in those products. The distinction matters, because the price is not tied to the yield of the tokenized paper.
Supply mechanics are the hard point. Of a maximum 10 billion ONDO, 4.869 billion are in circulation, or 48.7 percent. At a price of $0.4141 that gives a market capitalization of $2.02 billion, but a fully diluted valuation of $4.14 billion. More than half of the supply can therefore still reach the market. For buyers that is a structural headwind which works independently of the chart.
In regulatory terms, the tokenized securities field stands differently from a pure crypto token: in the EU, securities rules apply to financial instruments, not the MiCA regulation alone. The competent body at European level is ESMA, whose publications keep refining the boundary between crypto-assets and financial instruments. Part of the project’s business basis therefore rests on a legal framework that is still moving. Whether that is a tailwind or a brake cannot be decided today.
What argues for buying Ondo at the current price
Three points argue in favor, and they carry different weight.
- The technical position has turned. Ondo stands above the 200-day line of $0.3757 and above the 50-day line of $0.3589. The twelve-month low of $0.2247 is seven months back and has not been tested again since.
- Demand is measurable, not asserted. Daily turnover of $251 million against a market capitalization of $2.02 billion means sufficient liquidity to move even larger positions without a strong price impact.
- The distance to the high is large. At 61.6 percent below the twelve-month high of $1.0788, a considerable part of the 2025 euphoria has left the price. That lowers the setback potential compared with a purchase near the high, without eliminating it.
What argues against buying Ondo at the current price
Three points argue against, and the first weighs heaviest.
- Half the supply is still outstanding. 5.131 billion ONDO are not in circulation. Every release meets a market that first has to absorb that quantity. The gap between a $2.02 billion market capitalization and a $4.14 billion fully diluted valuation is not a detail but the central burden on this token.
- The entry happens below a confirmed resistance. The zone around $0.45 to $0.48 has already held twice in 2026. Anyone buying at $0.4141 has a few percent of room to the next test and around 13 percent of distance to the next support.
- The annual balance remains clearly negative. Minus 61.6 percent over twelve months is not a slip but a sustained move. The recovery over 30 and 90 days does not yet reverse that finding.
How to buy Ondo at the current price: costs, custody, providers
Ondo is listed on most large trading venues. For investors in Germany and Austria, three points count in practice: the venue, the fees and the question of where the token sits afterwards.
On the venue, it pays to look at total costs rather than the stated order fee: alongside the commission there is the gap between the buying and selling price, which is regularly wider for smaller tokens than for Bitcoin. Which providers perform how is set out in the comparison of the best crypto exchanges, and the regulatory classification in the overview of regulated crypto exchanges.
On custody, the usual trade-off applies: anyone trading short term leaves the token on the exchange. Anyone planning to hold longer moves it to their own wallet and carries responsibility for access themselves. We have set the devices side by side in the hardware wallet comparison.
A note on position size: with a token whose price has moved from $1.0788 to $0.2247 and back to $0.4141 within twelve months, position size decides more about the outcome than the moment of entry.
So is Ondo a good buy at the current price?
In the short term the starting position is demanding. At $0.4141 the price sits close below a resistance that has held twice, the RSI of 64.0 still leaves room, and volume is above the annual median of $80 million. In this constellation a breakout is as possible as a fall back to the 50-day line at $0.3589. A short-term entry is therefore less a question of analysis than of risk.
In the long term everything hangs on two figures that have nothing to do with the chart. The first is the release of the outstanding 5.131 billion tokens. The second is whether tokenized government bonds and money market products find use beyond the current circle. If both turn out favorably, today’s valuation of $2.02 billion is low. If one of them does not, it is not.
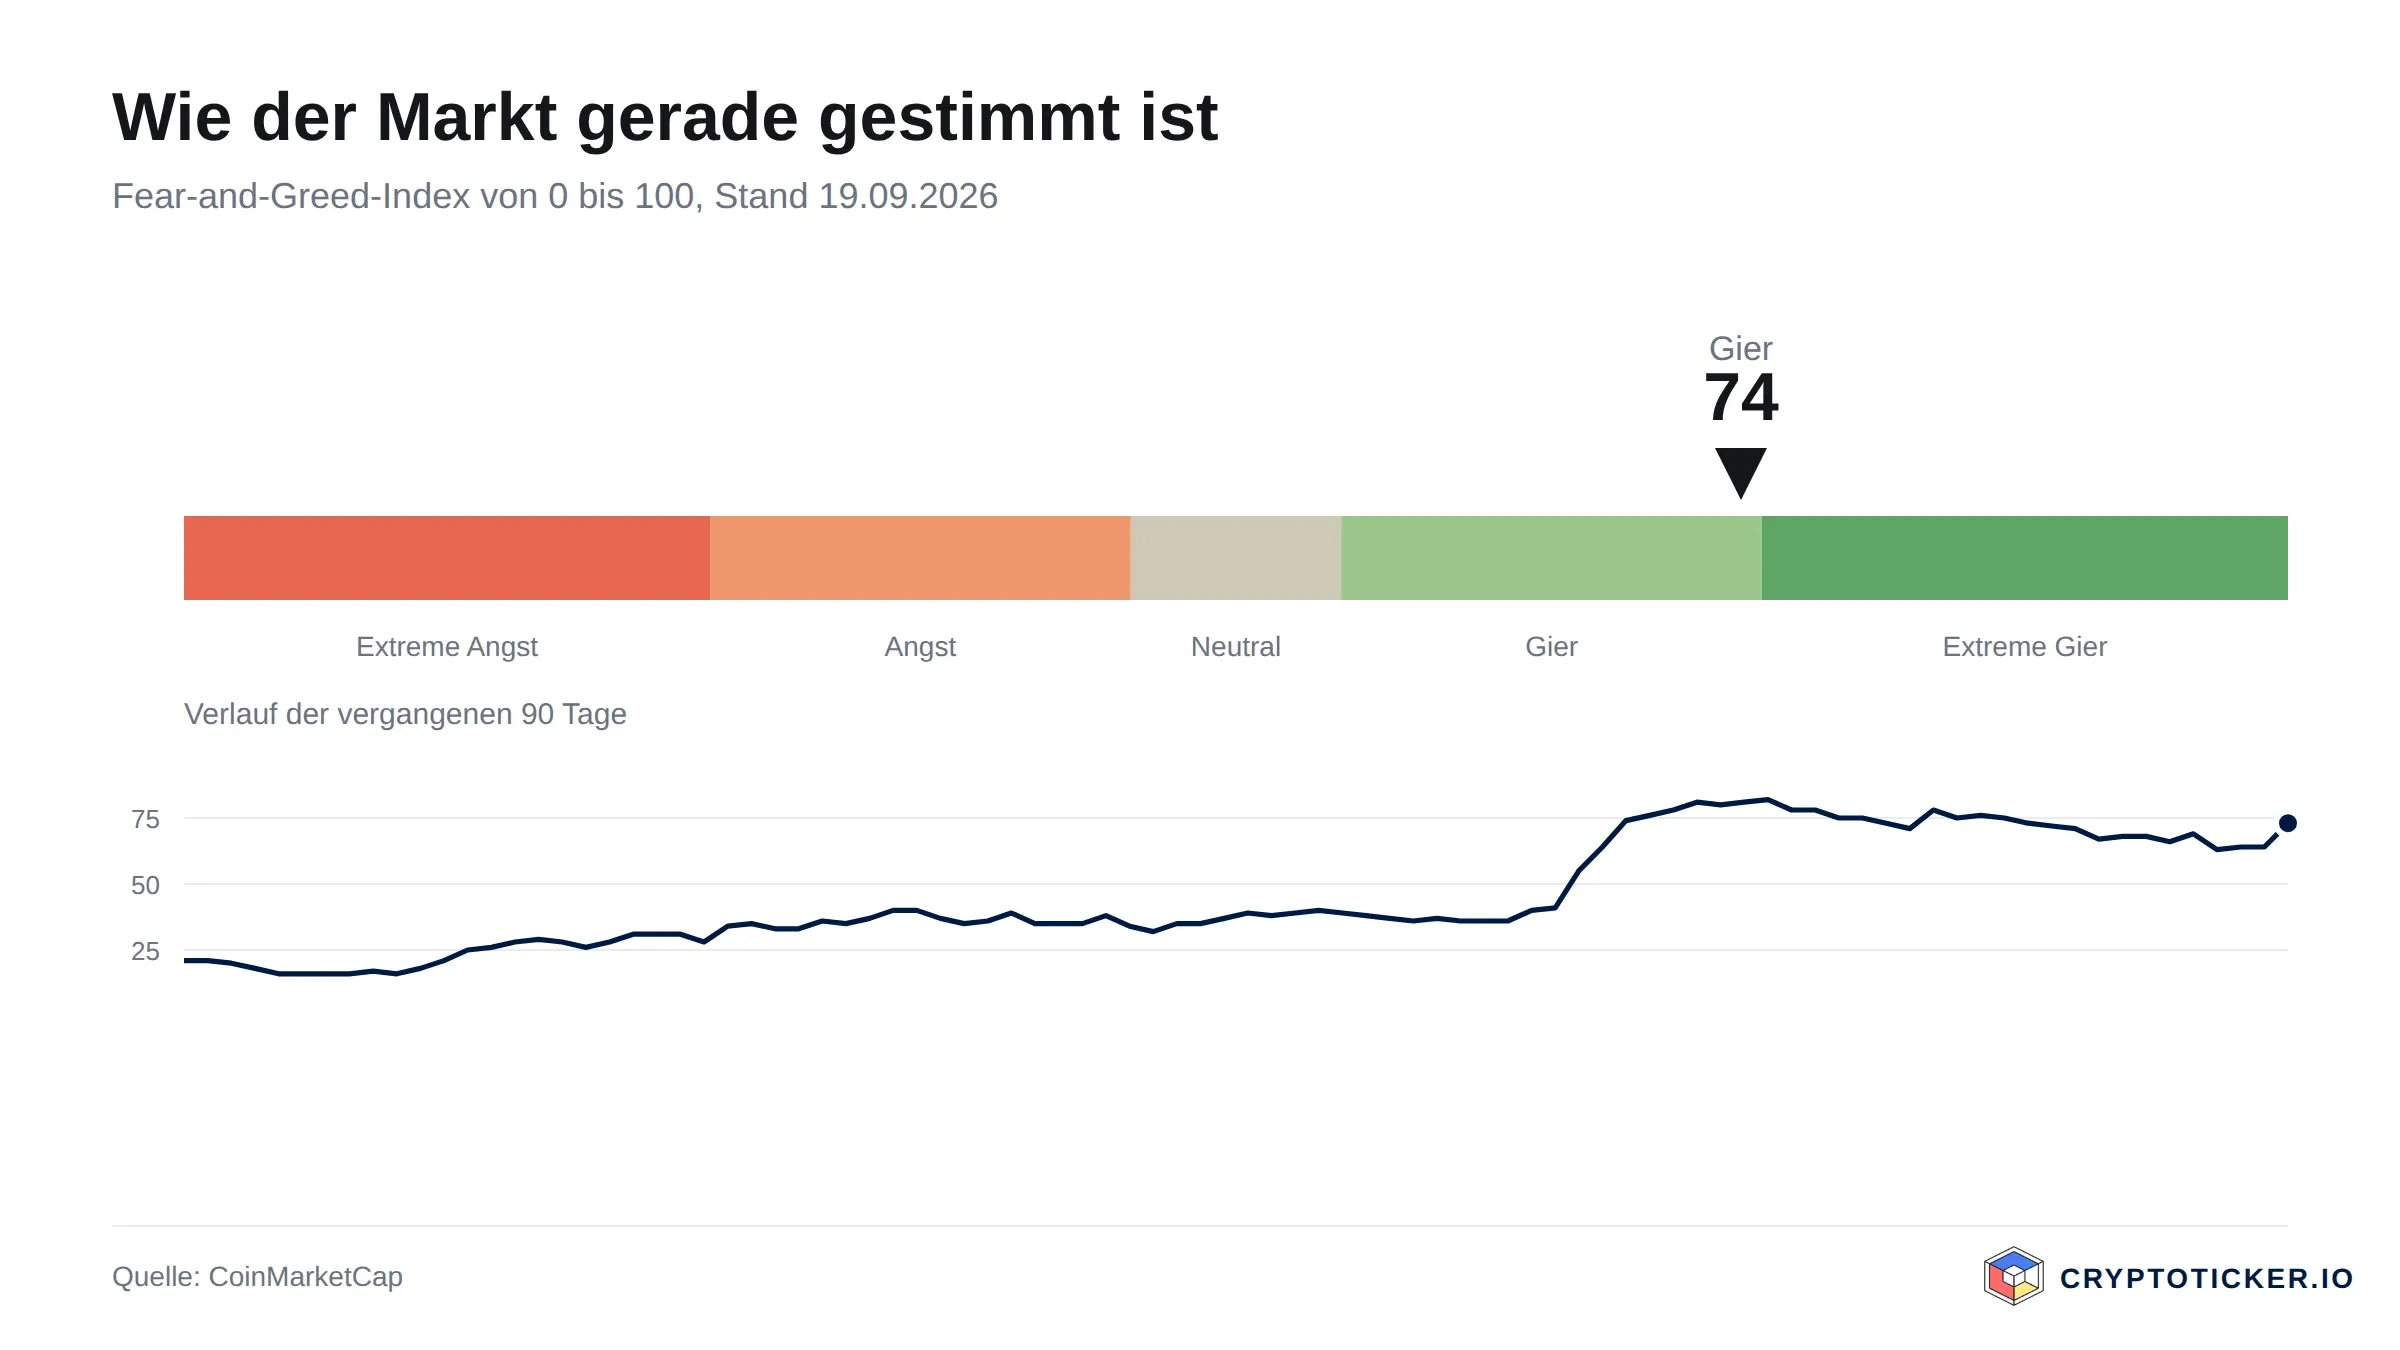
We are not issuing a recommendation here; we are naming the conditions. The assumption of a bottoming process counts as refuted if Ondo posts several daily closes below the 50-day line of $0.3589 and volume falls below the annual median of $80 million in the process. It counts as confirmed if a weekly close above $0.48 succeeds and the 50-day line crosses the 200-day line from above. For context on the wider market: the Fear and Greed Index stands at 74 on the collection date, placing it in greed territory. Historically that is not a favorable environment for entering a token that already has a 17.6 percent weekly gain behind it.
Buying Ondo: what to take away
- The chart position is friendly but tight. Ondo trades above both averages and below a twice-confirmed resistance. You will find the longer-term markers in the Ondo price prediction.
- Supply mechanics are the single biggest risk. With 48.7 percent in circulation, more than half is still outstanding. Anyone entering anyway should watch total costs at the venue, see the comparison of the best crypto exchanges.
- Holding period decides custody. For longer positions the token belongs off the exchange and in your own wallet; the differences are set out in the hardware wallet comparison.
Disclosure: some of the providers named in this article work with us through partner programs. This has no influence on the price analysis or the assessment of the chart position; the price data comes from a public market data source and can be verified there.
(As of September 19, 2026. This article is not investment advice. Prices and fee structures change; check the terms with the provider before you buy. Crypto-assets are subject to sharp price swings, and a total loss is possible.)






Be the first to comment