


What to know:
- JasmyCoin (JASMY) is testing a key monthly trendline, a support level that could determine its next major move.
- Analysts are watching for a rebound toward $0.03, as holding above support may strengthen bullish momentum.
- Technical indicators remain bearish despite oversold conditions, with the MACD signaling continued selling pressure.

JasmyCoin (JASMY) is testing a critical long-term trendline that could shape the next move for the JASMY price. A rebound may strengthen bullish momentum, but technical indicators remain negative, with ongoing selling pressure and bearish signals suggesting sellers still dominate despite oversold market conditions.
At the time of writing, JASMY is trading at $0.004695 with a 24-hour trading volume of $10.6 million and a market capitalization of $232.16 million. Despite the signs of stability over the last 24 hours, the JASMY price structure points to a bullish reversal ahead.
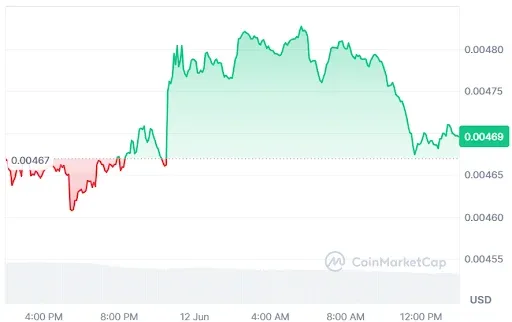

Source: CoinMarketCap

Also Read: JASMY Price Analysis: Breakout Above $0.00565 Could Trigger Rally to $0.006
JASMY Price Holds Key Trendline, Eyes $0.030 Rally
Furthermore, the crypto analyst Team LAMBO highlighted that JASMY is presently trading right around its long-term monthly trend line, which is a technically important level for any trader to keep an eye on.
At this point, the JASMY price is perfectly stable within this range because it does not show any signs of breaking away from this support level.


Source: Team LAMBO’s X Post
Another powerful bounce off the trendline can trigger bullish pressure, creating a potential for a move towards the resistance at the $0.030 level.
Buyers can use the recent JASMY price action to confirm whether or not they are protecting support. As long as the trendline holds, there is a chance that the JASMY price will have a successful recovery.
JASMY Technical Analysis Points to Bearish Dominance
According to TradingView, the JASMY price is experiencing consolidation in April before an unprecedented surge in mid-May to $0.00780.
A rapid selling off pushed the JASMY price back into a downward trend. The coin’s price fell below the 20-day simple moving average in June to trade at 0.00470, a -2.17% decline for the day.


Source: TradingView
Technical signals have revealed that there is robust momentum to drive the market downward. In this regard, Bollinger bands became broader as the market was hitting its peak, and presently, the JASMY is constrained by the lower band around 0.00429.
Further, the moving average convergence divergence’s lines have crossed, falling below the zero level in red.
This article contains market analysis and price predictions. These are not guarantees. Crypto markets are volatile. Always DYOR. Not financial advice.
Also Read: JASMY Price Analysis: Key Support Holds Amid Rising Bearish Pressure
Be the first to comment