


What to know:
- JasmyCoin (JASMY) is forming a falling wedge pattern, with early signs of recovery as price holds above key short-term support levels.
- Analysts suggest a potential breakout from the wedge structure could trigger a strong upside move, with a long-term target near $0.023.
- The RSI is above average, and a bullish MACD crossover hints at improving short-term strength.

JasmyCoin (JASMY) is forming a falling wedge pattern, showing early signs of recovery as momentum gradually improves. The asset remains above key short-term support levels, indicating underlying strength in price action. A breakout from this structure could signal a stronger trend if buying pressure continues.
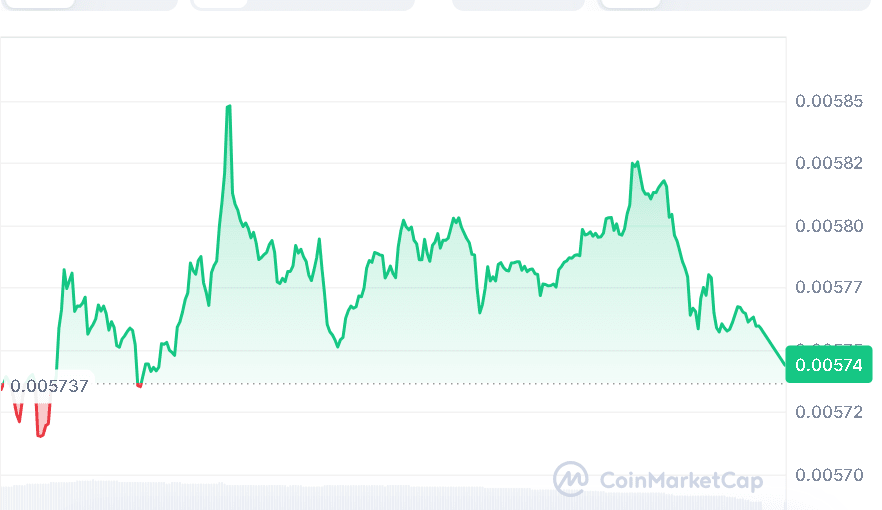
At the time of writing, JasmyCoin is trading at $0.005743, with a 24-hour trading volume of $7.13 million and a market capitalization of $285.25 million, according to data from CoinMarketCap. The token has posted a modest 0.07% gain over the last 24 hours.

Source: CoinMarketCap

Also Read | Aster (ASTER) Price Consolidates at $0.66: Can Bulls Push Toward $20 Next?
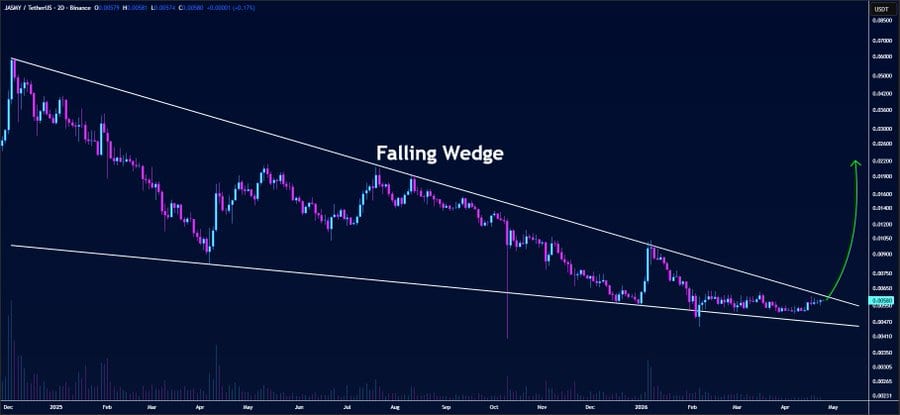
JasmyCoin Wedge Builds Breakout Pressure
Crypto analyst Butterfly noted that the JASMY token was forming a consolidation just below the upper edge of a falling wedge formation on a two-day time frame. This formation is well followed by technical analysts since it often leads to a possible change in trend direction.

Source: Butterfly’s X Post
According to Butterfly, the pattern is still well-structured, with prices observing the resistance level on top and support level below in a controlled fashion. JASMY may be in a position to achieve an explosive breakout above its wedge resistance line.
This is set to open up an opportunity for a substantial surge higher. If this happens, the coin will have the potential to reach the $0.023 mark, which is quite a distance from the current price levels.
JASMY Shows Mixed Recovery Signals
The technical indicators reveal some progress on the momentum side, though only to an extent. With the RSI at 57.19 and above the average at 53.99, the market is seeing a bit of upward pressure.
Furthermore, there appears to be some emergence of short-term support on the price side, as seen by the 20-day SMA and 50-day SMA being 0.00551 and 0.00553, respectively.

Source: TradingView
But the overall trend is still relatively weak since JASMY is still trading under its 100-day SMA level of 0.00586 and 200-day SMA level of 0.00706. The fact implies that bull strength still needs to be confirmed because the trend has yet to regain its momentum.
The momentum is starting to show a slight turn in favor. There is a bullish crossover as shown by the MACD, where the MACD line at 0.00008 is above the signal line at 0.00004. The histogram is green at 0.00004. Despite these signs being positive, they show that the market has not fully recovered yet.
This article contains market analysis and price predictions. These are not guarantees. Crypto markets are volatile. Always DYOR. Not financial advice.
Also Read | Chainlink Breakout Surge Targets $15–$19 in Explosive Rally Setup

Be the first to comment