


What to know:
- KASPA shows bullish recovery signs as price reclaims key moving averages, signaling potential reversal after accumulation.
- Volume surges over 50%, reflecting rising participation and investor interest despite declining open interest.
- Technical indicators show structural shift, with KASPA breaking key EMA resistance between $0.034–$0.035.

Kaspa (KAS) is recovering from accumulation with improving price action moving toward prior highs. Technical indicators show reclaimed moving averages and a potential reversal for the Kaspa price. However, derivatives data shows declining open interest, indicating reduced leverage and cautious market sentiment with profit-taking. According to CoinMarketCap, KAS is trading at $0.03830 with a weekly gain of 12.57%.


Source: CoinMarketCap
KAS Rising Volume Points to Upward Potential
According to Coinglass, volume increased by 50.77%, reaching $89.93 million, indicating strong market activity and heightened trading interest compared to previous levels, suggesting increased participation, liquidity expansion, and potentially rising volatility across the assets.


Source: Coinglass
However, open interest decreased by 4.50%, settling at $55.95 million, reflecting reduced outstanding derivative positions, weaker trader commitment, and possible profit-taking or position unwinding, which may signal cooling sentiment and lower leverage exposure across the market.
Also Read: Solana Price Surges Above $97 as Bulls Defend Key Support Levels in Strong Uptrend
Kaspa Price Action Signals Rally After Accumulation
Furthermore, the crypto analyst JACKIS highlighted that KAS appears to be emerging from an extended build-up phase, where the Kaspa price is now gravitating towards the high reached back in March.
A breakthrough here could herald a much stronger Q2 bounce, while failure will only prolong the period of trading in a narrow range. In either case, however, the current environment indicates a strengthening trend following the bear market from 2024.


Source: JACKIS’ X Post
Market conditions indicate that there is very limited supply overhead and that the only major level of resistance for the Kaspa price is at $0.077.
This lack of liquidity overhead may help facilitate a faster rise if bull power makes a resurgence. This could allow any future advance to take place without much difficulty.
Technical Indicators Point to Improving Strength
According to TradingView, the Kaspa price trend has transitioned from its bearish bias to an emerging recovery.
With an abrupt fall early in the year 2026, the Kaspa price fell to touch the support level of $0.0260 before stabilizing below the 200-day exponential moving average of $0.04323. The Bollinger Bands suggest that the asset is forming a base.
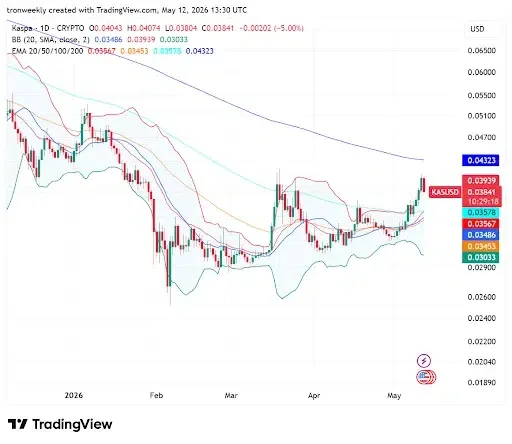

Source: TradingView
Recent trading sessions indicate a strong uptrend as the asset reaches $0.03841 despite a small dip during the day.
The Kaspa price manages to move past the 20-day, 50-day, and 100-day EMAs and is now situated between $0.03453 and $0.03578. In order for a full reversal of the trend to occur, the Kaspa price needs to rise above the 200-day EMA.
This article contains market analysis and price predictions. These are not guarantees. Crypto markets are volatile. Always DYOR. Not financial advice.
Also Read: Bitcoin Price Builds Strength Above Support While Bulls Target $94K

Be the first to comment