


What to know:
- Ethereum shows short-term weakness after repeated rejection near the $2,360 resistance.
- Lower timeframe trend remains bearish despite broader ascending structure.
- Weekly indicator signals a critical test that may decide the next major move.

Ethereum is entering a critical phase as mixed signals appear across different timeframes, raising uncertainty over its next direction.
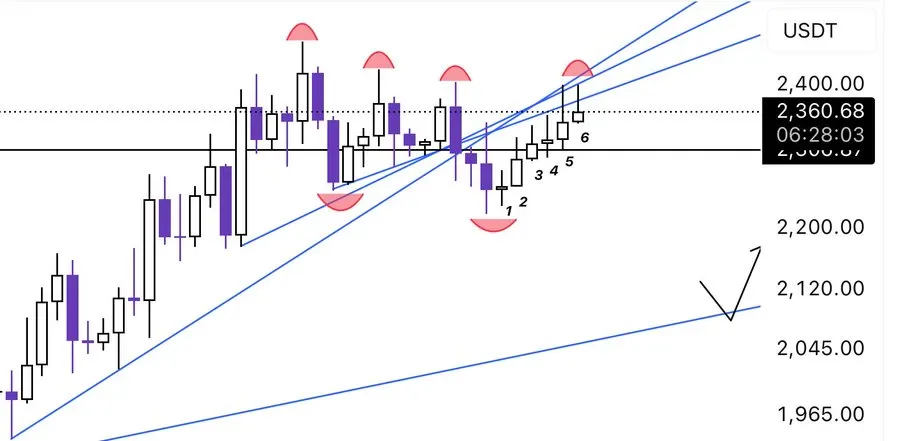
As mentioned by crypto analyst ctm_trader, Ethereum experienced 12 consecutive bullish candles on its 12-hour timeframe before it was rejected strongly.
The price attempted to break above the breakdown trendline, which previously acted as support, but failed to hold onto it. This suggests that although Ethereum recently rose, there are still sellers above.

The chart reveals that Ethereum is rising within an upward channel, and it remains within an uptrend. The currency had been registering higher peaks and higher troughs, indicating a bullish movement.
However, reversals have constantly been occurring at levels of $2,350-$2,400, indicating significant resistance levels.

Source: X
Following these rejections, the market entered a consolidation stage. Movement in price action became tighter, resulting in a pattern of smaller candles appearing close to the resistance level.
Although there is a slight bounce in price action, showing a higher low, failure to breach the significant resistance indicates buyer uncertainty.
Also Read: Andreessen Horowitz Expands Crypto Dominance With $2.2 Billion Fund
Key Levels Define Next Direction
Ethereum is currently at an important juncture. The value of Ethereum is hovering close to the zone where the horizontal resistance and upper price channel meet. The current resistance zone is situated close to $2,360.
If Ethereum manages to get out of this zone and stays above, it may be able to target $2,400 and even go above in the channel. Otherwise, the price may fall.
In the bearish case, we can see a decline towards the lower trend line resistance, which is at $2,100-$2,150. Such an occurrence would not change anything in the upward movement as long as the lower trend line resistance level holds its place.
Ethereum Weekly Indicator Adds Pressure
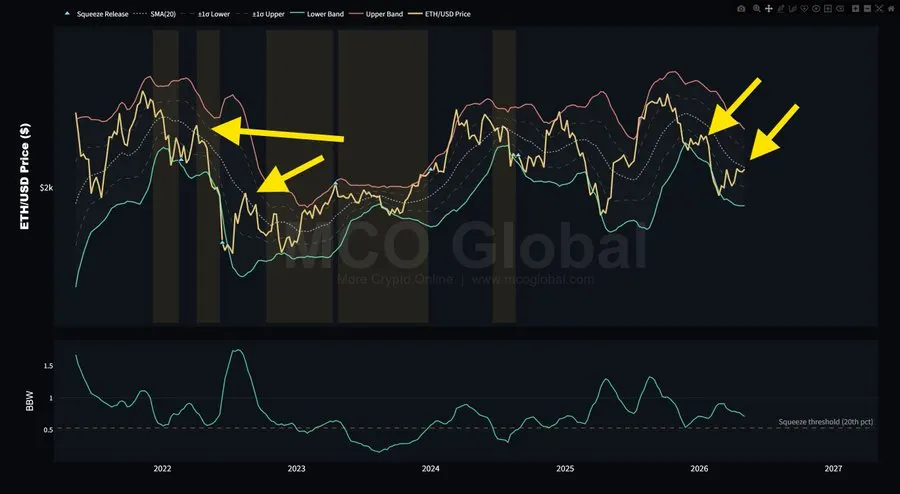
On the other hand, the analyst More Crypto Online pointed out a significant detail concerning the chart with weekly candles.
Currently, Ethereum is hovering around the level of the middle band of the Bollinger Bands from the lower part of it, and such positions usually become critical for traders’ decision-making.

Source: X
Indeed, in the previous bearish wave, such situations were followed by rejection, and therefore, this level served as resistance rather than support.
Bollinger Bands reveal that periods of consolidation are followed by price ranges widening out at a later date. Current observations indicate that there will be a return to volatility following a period of volatility squeezing. However, the current price structure looks less compelling.
This article contains market analysis and price predictions. These are not guarantees. Crypto markets are volatile. Always DYOR. Not financial advice.
Also Read: Hyperliquid DATs Accumulate Close to 9% of HYPE Supply

Be the first to comment