


What to know:
- LDO breakout is confirmed on the 1D chart, with exiting a long-term descending channel and retesting it as support.
- Bullish momentum builds as MACD turns positive, signaling renewed buying after a prolonged bearish phase.
- LDO price targets $0.75 resistance, with traders watching follow-through buying for a potential reversal.

Lido DAO (LDO) is moving in an upward direction as BTC has maintained its position above $76K with strong momentum. According to CoinMarketCap, the LDO price has surged by 5.45% over the last 24 hours and 4.63% over the last week.
At the time of writing, LDO is trading at $0.3845, with a trading volume of $77.46 million, which has surged by 48.52% over the last 24 hours. However, its market capitalization stands at $326.52 million, which is also up by 5.01%.

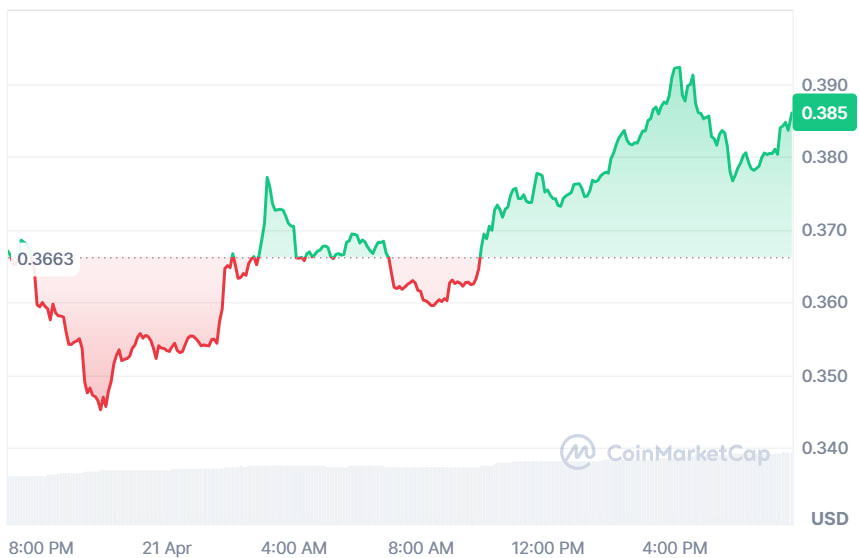
Source: CoinMarketCap

Also Read: Lido DAO (LDO) Fundamentals Remain Strong: Could It Push the Rally to $10?
LSO Shows Bullish Reversal After Channel Breakout
Furthermore, the crypto analyst ZAYK Charts pointed out that LDO has broken out of a long-standing descending channel on the 1D timeframe, followed by a successful retest of the breakout zone, which now acts as support.
This shift suggests weakening bearish pressure and a potential trend reversal as buyers begin to regain control after weeks of lower highs and sustained downward structure.

Source: ZAYK Charts’ X Post
If the test rally is sustained, the bulls can continue to make progress as long as the buying pressure continues.
Traders are now on the lookout for any attempt to break into the resistance area of $0.75. Confirmation is critical at this point, as the market sentiment and the performance of Bitcoin will determine its success.
Technical Indicators Point to Improving Bullish Strength
According to TradingView, LDO shows a steep increase followed by a correction. The price rose above $0.44 but then fell below the faster bands on the MA Ribbon chart.
However, recent candlestick formations indicate a bounce back as the asset seems to have stabilized at around $0.385 and is now attempting to break out higher.

Source: TradingView
The MACD indicator gives an indication of a shift in momentum. After an extended period of selling, the MACD line has moved above the signal line.
The histogram has moved into positive territory, signifying new buying pressure. Such an indicator suggests that momentum may switch to the upside provided that the token maintains its support levels.
This article contains market analysis and price predictions. These are not guarantees. Crypto markets are volatile. Always DYOR. Not financial advice.
Also Read: LDO Price Analysis: 93% Crash Signals High-Risk Accumulation Zone

Be the first to comment