



Chainlink extended its weekly gains on Friday, with LINK trading above $13.70 and rising more than 7% this week, at the time of writing. Institutional demand, derivatives positioning, and partnerships supported momentum across the market.
What Is Driving LINK Price Higher?
Chainlink (LINK) short-term outlook maintained a bullish formation amid investor focus on rising market interest. Inflows into spot LINK exchange-traded funds (ETFs), positive funding rates, and an Infosys collaboration supported LINK.
Also Read: XRP Price Analysis: Can XRP Break $1.61 After Recovery?
Popular analyst Crypto Patel highlighted that in a post on X, LINK had rallied close to 90%, having gained from a level of $7. According to Patel, his target is achieved, yet LINK remains aligned with his roadmap projections at $20, $50, and $100.

LINK currently retraces its trendline breakdown resistance level around $12 recorded in January. Any breach above this level will maintain Patel’s roadmap validity.
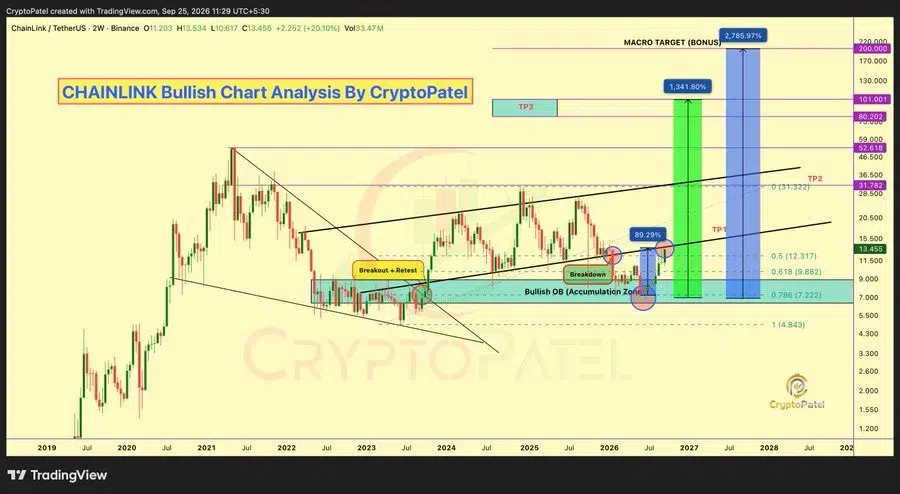
The analyst expects LINK to undergo consolidation back towards $10 in case of rejection below the trendline. The $10 level may emerge as a potential buying opportunity based on analyst strategy.
Additionally, another analyst, Alex Marzell, identified a double bottom pattern at $12.06 and $12.10, after which LINK rallied nearly 17%.
According to Marzell, the cryptocurrency broke above $13.55 and subsequently trades around $14.08 and $13.83 and is identified as the key level for the near-term structural outlook.
On maintaining support around $13.83, analysts forecast the next upside test around $14.16, whereas breaching below the latter implies revisiting $13.55.
Why Are LINK ETF Inflows and Derivatives Signals Improving?
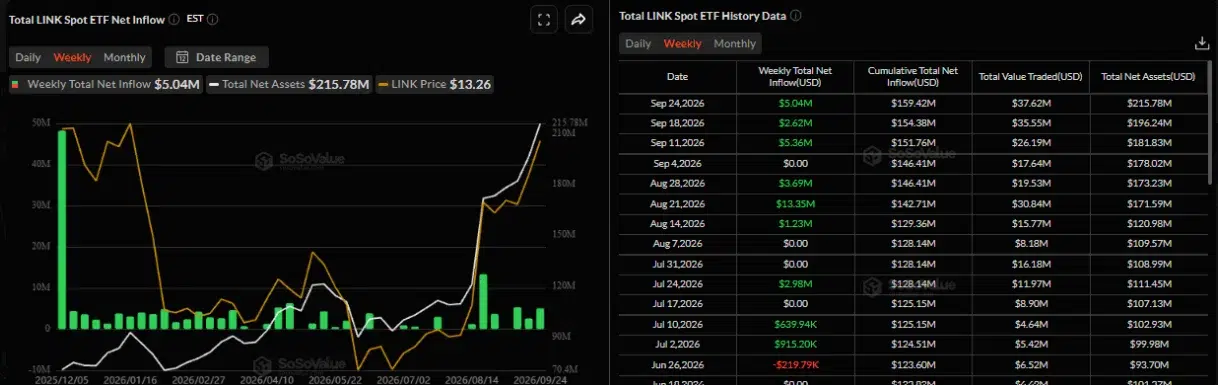
Demand from institutional investors was robust during the week. According to the SoSoValue data, spot LINK exchange-traded funds (ETF) amounted to $5.04 million in inflows through Thursday.
With inflows expected for the third consecutive week, such momentum will bolster the rebound of LINK prices.
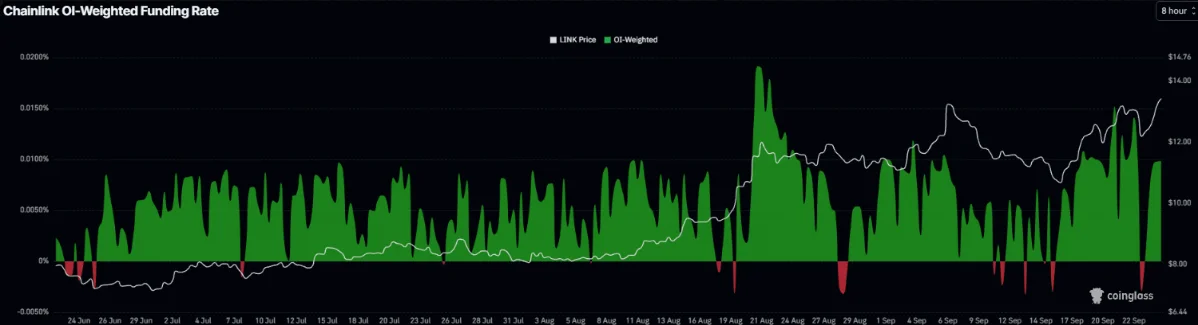
Derivatives data shows robust trader positioning as well. According to CoinGlass data, LINK funding began registering positives since Wednesday and increased to 0.0098% on Friday.
Positive funding indicates that longs pay shorts, typically indicative of elevated demand for bullish positioning via perpetuals.
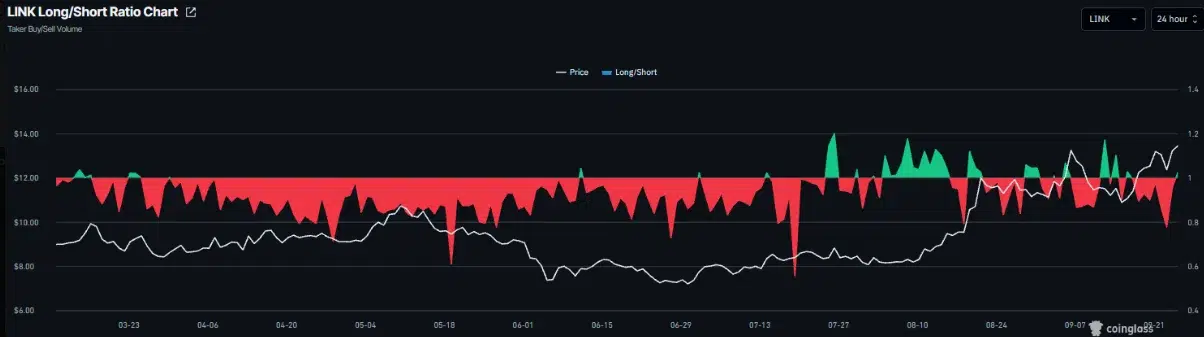
In addition, CoinGlass highlighted a Chainlink long-short ratio of 1.02 as of Friday. Long-short ratios above one suggest that long positions outweigh short positions marginally.
The ratio suggests a moderately positive trend expectation. Nonetheless, the ratio maintained proximity to neutrality and failed to show any extremity.
Who Is Supporting Chainlink’s Institutional Expansion?
In a statement released on Tuesday, Chainlink announced its partnership with Infosys, a global information technology company with a market capitalization above $40 billion.
Infosys currently serves over 1.7 billion user bank account relationships globally. The corporation intends to standardise its deployment of the Chainlink solution across its offerings.
According to Chainlink, the partnership seeks to facilitate financial institutions’ connectivity to on-chain markets. This represents yet another institutional application for the network.
The development provides further upside potential for the LINK token price. This follows Chainlink’s recent focus on targeting banks, payment providers, and other financial entities.
What Do Technical Indicators Signal for LINK Price?
According to TradingView data, the LINK price trades close to $13.70, well above all key Exponential Moving Averages (EMAs). While the 50-day EMA stands at $11.24, the 100-day EMA sits at $10.37, below the prevailing market price.
The 200-day EMA is at $10.27, also below the current price, thus validating the technical structure.
Momentum indicators were also positive. The Relative Strength Index (RSI) is at 64, while MACD stayed comfortably in positive territory, confirming a healthy uptrend.
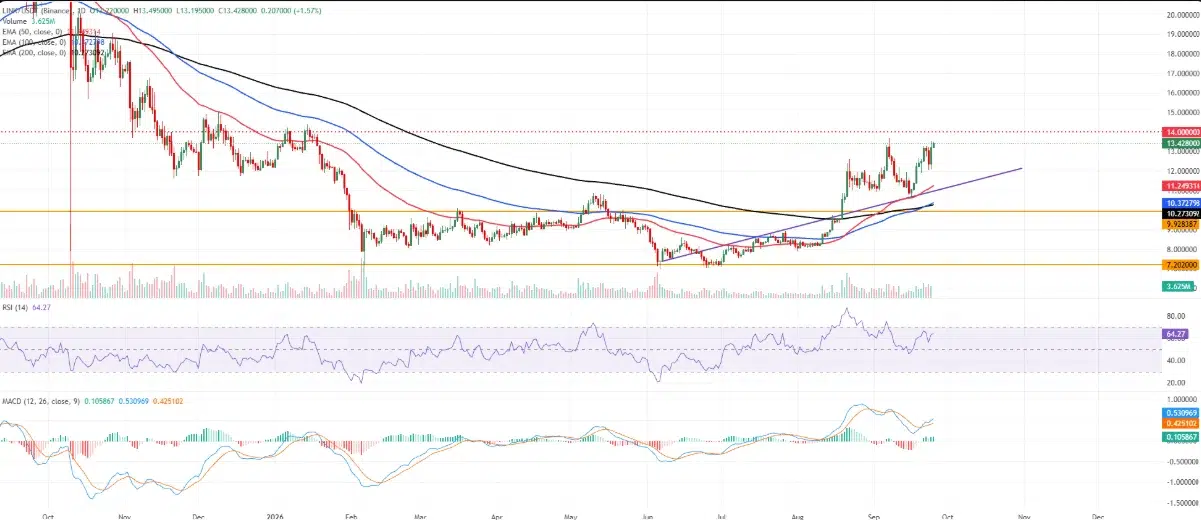
Resistance pressure at $14.00 could emerge immediately should bulls resume efforts at breaking out above current resistance levels.
Further short-term resistance occurs at Marzell’s $14.16 high. Breaking higher than that level preserves the possibility of continued recovery for LINK prices.
On the downside, the 50-day exponential moving average is at $11.24 and acts as the key level of support. The 100-day and 200-day EMAs expose a wider demand range of $10.37-$10.27.
A sustained fall will bring support at $9.92, below which the $7.20 structural base becomes important only on realizing a substantial corrective rally.
Currently, the LINK price finds support on strong inflows, positive derivative signals, and partnership with Infosys. Traders are watching resistance near $14.
Also Read: Stablecoin Yield Ban: Fed’s GENIUS Rules for Issuers
This article contains market analysis and price predictions. These are not guarantees. Crypto markets are volatile. Always DYOR. Not financial advice.


Be the first to comment