



Litecoin price celebrates its 15th anniversary while the network faces yet another examination of its recent market strength, with derivatives activity remaining high even as LTC retreats from its early-October peaks.
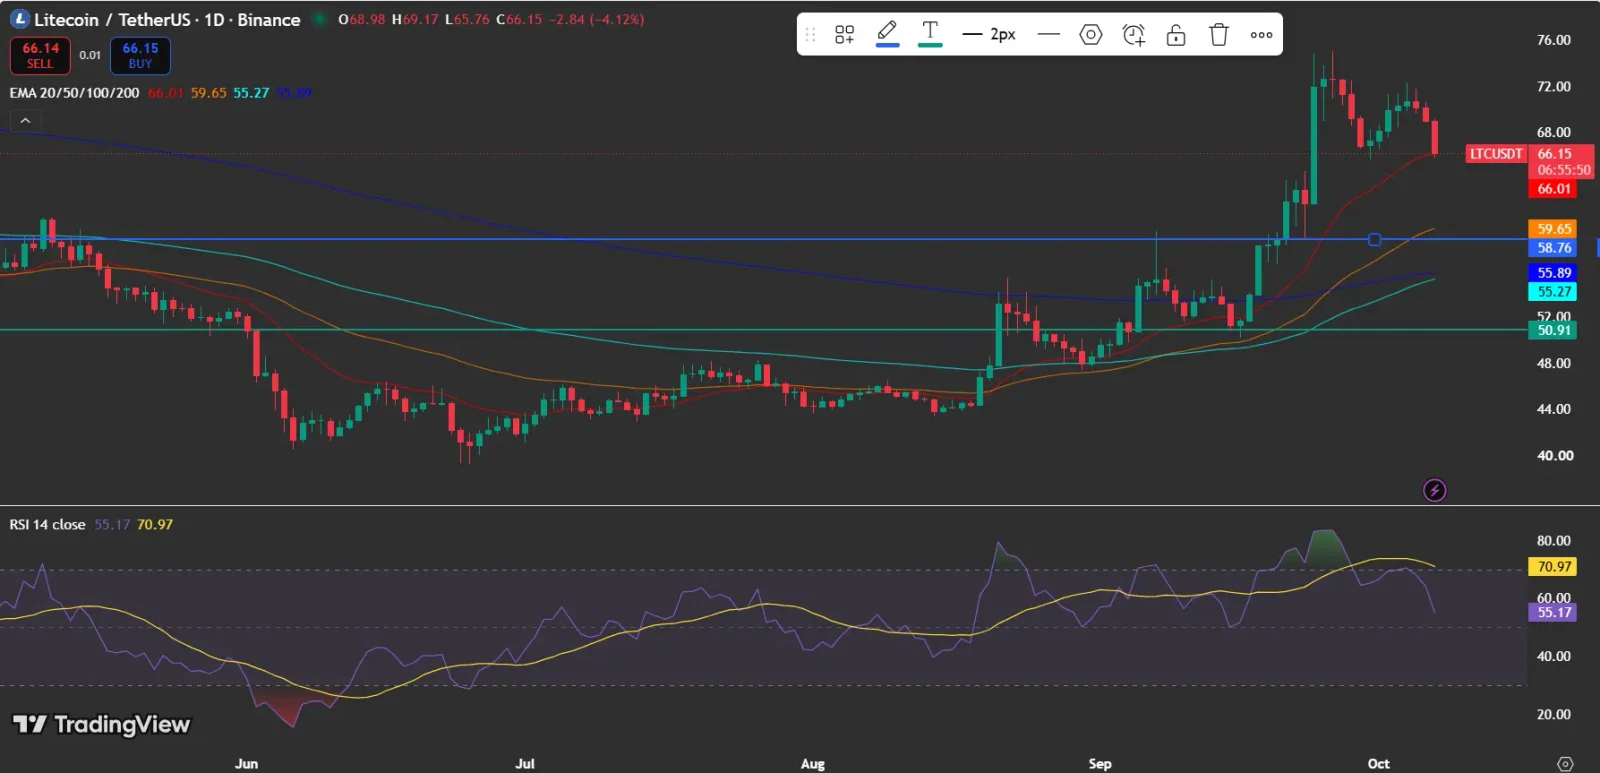
As of press time, Litecoin price is changing hands at $66.15, a 4.12% drop over the last 24 hours. This pullback has driven the price back down to its 20-day EMA, turning the $66 zone into a crucial near-term threshold for the prevailing trend.
Also Read: Litecoin Price Eyes Breakout Toward $410 as Bullish Momentum Builds
Why the Litecoin Price Draws Attention at 15
The anniversary of Litecoin offers the market a new fundamental perspective. Fidelity Digital Assets has pointed to the network’s enduring track record, noting that close to 79 million LTC are in circulation.

“Since its initial launch, Litecoin remains one of the longest-running digital asset networks, with nearly 79 million LTC in circulation.”
This milestone carries weight because Litecoin enters its 16th year with a mature market structure instead of depending on a freshly introduced narrative. The central question now is whether such maturity can turn into fresh momentum following LTC’s latest rally.
What Is the Litecoin Price Chart Indicating?
According to the TradingView chart, LTC is still positioned above its key moving averages in spite of the recent drop. The 20-day EMA stands at $66.01, whereas the 50-day, 100-day and 200-day EMAs are located at $59.65, $55.27 and $55.89, respectively.
The overall positioning stays largely constructive, given that the shorter-term average remains above the longer-term averages. Even so, LTC is currently testing the 20-day EMA, meaning a sustained break below the $66.01 EMA might undermine the near-term bullish setup.
Also Read: Litecoin Price Holds $60 as Network Activity Nears $1 Billion
Can the Litecoin Price Defend Critical Support?
The chart identifies a significant support band near $58.76-$59.65, where the marked horizontal level and the 50-day EMA are clustered. A lower level emerges around $50.91, which may come into play should selling pressure intensify.
To the upside, LTC must retake the recent $69-$72 region to restore stronger momentum. The chart indicates the token had earlier climbed above $72 before pulling back, which makes that area a key resistance zone.
How Is Litecoin Price Momentum Shifting?
At present, the RSI stands at 55.17, which indicates that momentum is still positioned above the neutral 50 threshold, though it has dropped considerably from the stronger levels seen recently. Furthermore, the RSI has slipped beneath its moving average, which sits near 70.97, signaling that short-term momentum has weakened.
The resulting situation is a mixed one. While the moving averages continue to provide support, the RSI indicates that buyers have ceded some control following LTC’s latest price climb.
Also Read: Litecoin Price Gains Institutional Momentum as Canton cLTC Fuels $500 Debate
How Does CoinGlass View the Litecoin Price?
According to CoinGlass, Litecoin’s open interest has surged markedly since late September, hitting approximately the mid-$600 million mark by October 7. This suggests that derivatives positioning is still considerably elevated compared with much of August and early September.
Trading volume likewise rose sharply during the late-September rally, with the biggest evident spike hitting about $2.5 billion. Since then, volume has tapered off, which implies the heavy activity surrounding the breakout has eased.
The liquidation chart additionally reveals multiple sizable liquidation events across the recent rally and subsequent pullback. Because funding-rate information does not appear in the supplied CoinGlass charts, the available data does not allow any conclusion to be reached regarding the current funding bias.
What Should Traders Keep an Eye On Next?
The first hurdle for Litecoin price is whether LTC can stay near $66 and push back up to $69-$72. Remaining above the 20-day EMA would preserve the existing uptrend structure, whereas a prolonged break beneath the $58.76-$59.65 support zone would undermine it.
The anniversary supplies Litecoin with a well-timed fundamental catalyst, yet the chart still requires confirmation from price behavior and derivatives activity. At this point, the market is weighing a well-established network narrative against short-term momentum that is losing steam.
Cryptocurrency markets are still extremely volatile, so traders ought to track price action, market sentiment, and forthcoming catalysts prior to making any investment decisions.
Also Read: Litecoin Expands Cross-Chain Access as cbLTC Launches on Solana
This article contains market analysis and price predictions. These are not guarantees. Crypto markets are volatile. Always DYOR. Not financial advice.


Be the first to comment