


What to know:
- Litecoin Price holds strong near $55 as traders watch potential breakout signals emerge.
- Crypto Patel identifies $63, $80, and $100 as possible Litecoin Price targets.
- RSI and MACD indicators suggest bullish momentum is gradually building for Litecoin.

Litecoin price stayed close to a critical support level as technical analysis showed that there were chances of a breakout within a few weeks. At press time, LTC is trading at $56.36, trading with a 24-hour trading volume of $336.94 million and a market cap of $4.35 billion. The LTC has decline of 0.95% over the last 24 hours.
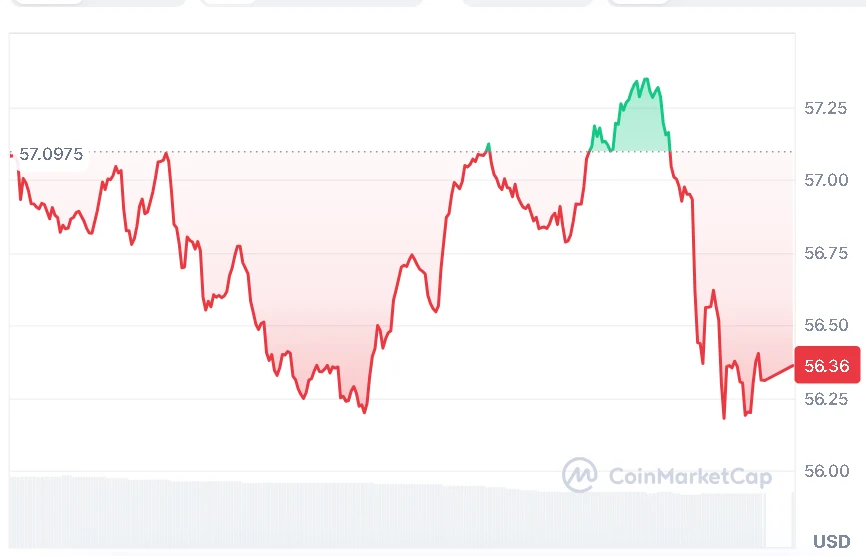

Source: CoinMarketCap
Also Read |NEAR Price Prediction: Technicals and Derivative Data Point to Bullish Reversal

Litecoin Price Shows Signs of Accumulation
On May 7, 2026, a crypto analyst, Crypto Patel, provided a positive forecast regarding Litecoin, stating that the crypto is gradually rebuilding its strength at the $55 mark. As per Crypto Patel, the Litecoin price is building a nice setup following a prolonged downtrend.


Source: Crypto Patel’s X Post
The observer mentioned that the price of LTC is now forming a crucial breaker pattern again, and at the same time, the internal liquidity is continuing to form. The momentum is also starting to shift following weeks of tight price action.
According to Crypto Patel, the ideal place for an entry is located in the range of $55 to $50 should Litecoin retests its support level. The stop loss is below $50, while the possible price targets include $63, $80, and even $100.
Patel further noted that confirmation will be required prior to looking for an important rally. Litecoin Price will probably have to see a positive retest or acceptance above the reclaimed breaker in order for buyers to take complete control of the market trend.
Litecoin Price Momentum Indicators Turn Slightly Positive
Bullish technical indications can also be seen in Litecoin. At the moment, the RSI is sitting at 55.75, whereas the RSI moving average is placed at 52.88. As long as the RSI is above the neutral reading of 50, buyers maintain an edge in the market.
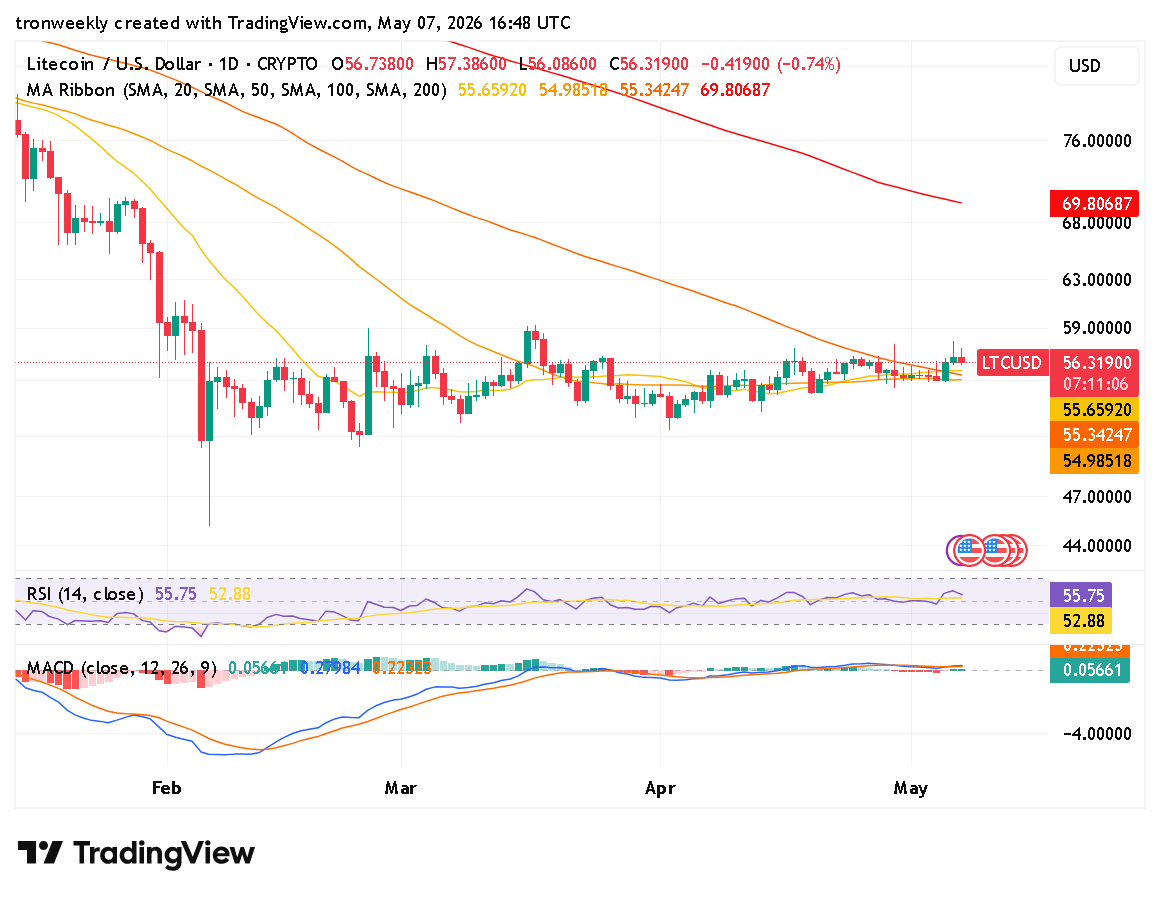

Source: TradingView
In addition to that, the MACD technical indicator gives out a positive divergence too. The MACD line of 0.27984 is higher than the signal line, which stands at 0.22323. In addition to that, the histogram value of 0.05661 indicates the presence of bullish momentum.
Overall, it seems that the Litecoin Price is gradually forming upwards momentum around the $56 level. Crypto Patel expects the bullishness of the buyers to assist LTC in breaking out to higher levels.
This article contains market analysis and price predictions. These are not guarantees. Crypto markets are volatile. Always DYOR. Not financial advice.
Also Read | HBAR Price Forecast: Liquidity Sweep Sparks Hope for a Rally to $0.108

Be the first to comment