



The stability of the Litecoin price at $60 corresponds to a notable rise in network activity to around $1 billion; therefore, there is a need to evaluate the sustainability of the current trend in comparison with key technical thresholds.
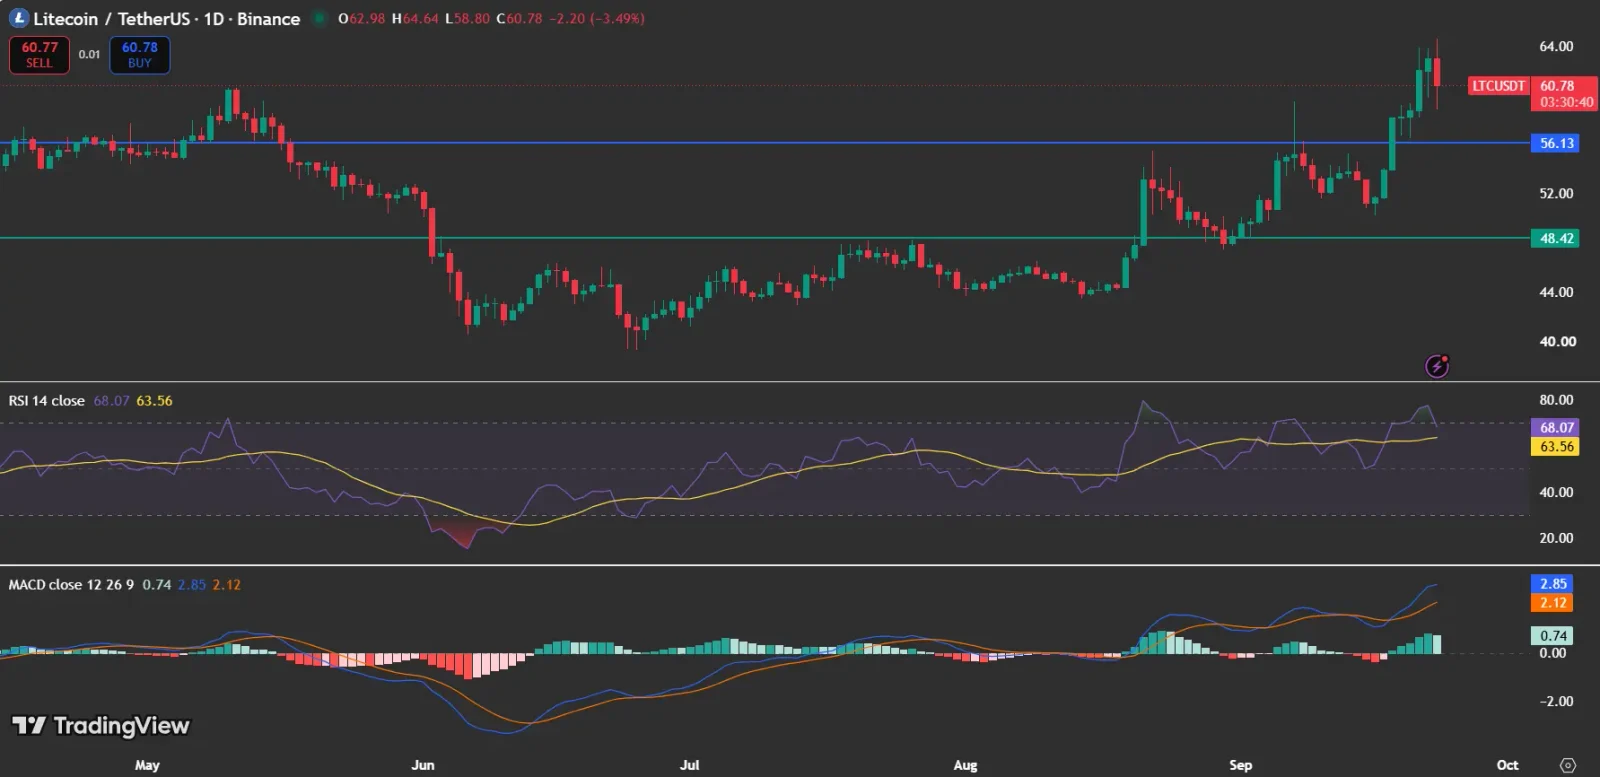
Litecoin currently has a price of $60.78, which reflects a decline of 3.49% over the past 24 hours. The maximum daily price for the currency was recorded at $64.64. In addition, the Litecoin network and derivatives market have seen increased activity recently.
Also Read: Litecoin Price Drops 3.22% Despite Rising Open Interest and Ecosystem Visibility
Why Is the Litecoin Price Pulling Back?
This pullback follows Litecoin’s notable price action for the month of September. Based on the chart on TradingView, Litecoin made an ascent from around the low-$50s earlier in the month before accelerating to break through the $56.13 resistance.

The latter is now turning into an important level of support. Litecoin is still trading above this support amid the pullback, while the nearest resistance is set at the recent high of $64.64. A breakdown below $56.13 will shift attention towards the next support at $48.42.
Also Read: Litecoin Price at $52.58 While MWEB Activity Hits New ATH
What Does the Litecoin Foundation Update Show?
According to a September 23 post on X, the Litecoin Foundation highlighted significant network activity, noting that “$1 Billion of value, over 17M Litecoin, moved across the Litecoin network in 24 hours.” The post described this as Adjusted Economic Volume, or “payments” as ForceX denotes it.
The Foundation also noted that the network’s 24-hour adjusted economic volume reached a higher level of $2.51 billion in May, showing that the latest figure represents substantial on-chain economic activity, although it was not the year’s highest.
Also Read: Litecoin Price Gains 6% as Network Fees Stay at $0.001
How Does the Litecoin Price Chart Look?
The technical indicators shown on the daily TradingView chart suggest the presence of strong positive momentum in spite of the last red candle.
The Relative Strength Index (RSI) has a value of 68.07 and is higher than its average of 63.56. The said number is close to the 70 mark, which is generally considered to be a level associated with overbought conditions. Hence, the momentum stays strong even though the market is approaching a level where caution may increase.
The Moving Average Convergence Divergence (MACD) line equals 2.85 and is located above the signal line with the value of 2.12 and histogram of 0.74. The positive MACD configuration supports the current upward momentum, although it does not by itself confirm that the price will continue higher.
Is Rising Open Interest Supporting the Litecoin Price?
The latest data from CoinGlass shows a significant increase in the open interest for Litecoin in September. In particular, open interest rose from around $370 million in mid-September to above $500 million on September 22.
The growth in open interest is consistent with the growth in Litecoin’s price. The fact that open interest is growing implies that there are more positions held in the derivatives market; yet, the open interest figure alone cannot identify whether traders are mostly bullish or bearish.
The trading volume has grown, too. According to the data from CoinGlass, recent Litecoin trading volume readings reached around $680 million to $730 million, among the highest levels seen on the chart.
Also Read: Litecoin Price Signals Bullish Momentum After $47.63 Breakout
What Does the Litecoin Price Need to Hold Next?
The confluence of increasing open interest, improved trading volume, and the upward MACD momentum is supportive of the current bullish trend; however, the recent pullback in Litecoin’s price leaves two key levels in focus.
Any sustained move above $64.64 would put the recent high under pressure and could signal a continuation of the upward move. On the other hand, any move below $56.13 will put the current setup into question and put $48.42 support into play.
Moreover, the DeFiLlama chart shows Litecoin’s TVL, active addresses, and transaction activity remaining elevated toward late September, adding another element to the ongoing story of increasing on-chain engagement.
Currently, the technical momentum is positive for Litecoin, with improved network activity and derivatives participation providing additional context for the current price trend. The next major focus remains whether Litecoin can hold $56.13 as support and challenge the $64.64 resistance level.
Also Read: Litecoin Price Rises 2.39% as AIBC Conference in Rome Captures Spotlight
This article contains market analysis and price predictions. These are not guarantees. Crypto markets are volatile. Always DYOR. Not financial advice.



Be the first to comment