



Shiba Inu trades at $0.00000521 on Tuesday evening, the equivalent of €0.00000466. The daily reading of $0.00000516 is the lowest since September 18. The entire recovery from the second half of September has been given back. Over 30 days SHIB is nonetheless almost unchanged, and that contradiction is the finding of this Tuesday.
Shiba Inu last stood lower than today on September 18
We analysed CoinGecko’s daily readings for the 36 days from September 9 to October 13 ourselves. In that series there is no day after September 18 on which SHIB stood lower than it does today. September 18 closed at $0.00000515; today’s daily reading is $0.00000516. Between them lie 25 days in which the price twice rose above $0.0000059 and twice came back.
Two further values from the same series matter for context. The low of the window dates from September 16 at $0.00000494, the high from September 23 at $0.00000610. Seven calendar days and a gain of 23.5 percent separate those two days. From the September 23 high to today it is 14.6 percent down.
The market value of all circulating SHIB stands at $3.07 billion, rank 38 by market capitalisation. The price is 93.9 percent away from the record of $0.00008616 set on October 27, 2021.

Why the monthly figure hides the week
CoinGecko puts SHIB at minus 0.5 percent over 30 days and minus 9.5 percent over seven days. In our daily series both figures come out somewhat larger: 1.5 percent against September 13, and 11.4 percent against October 6. The gap arises because CoinGecko takes the price from exactly 168 or 720 hours earlier, while a daily series sets fixed daily marks. Depending on the sampling point, the weekly loss is therefore 9.5 to 11.4 percent and the monthly balance 0.5 to 1.5 percent.
Both calculations say the same thing: the whole of the month’s loss arose in the past week. In the three weeks before that, SHIB was up. Read only the monthly number and you see a quiet month; read only the weekly number and you see a slump. Both are true, and each on its own is misleading.
The mechanism behind it is unspectacular and often overlooked. Two percentage figures covering two different periods refer to two different starting points. If a price first rises and then falls inside the longer period, the long horizon looks close to neutral even though the short one is sharply negative. For investors, that means a single percentage figure is no substitute for the path the price took.
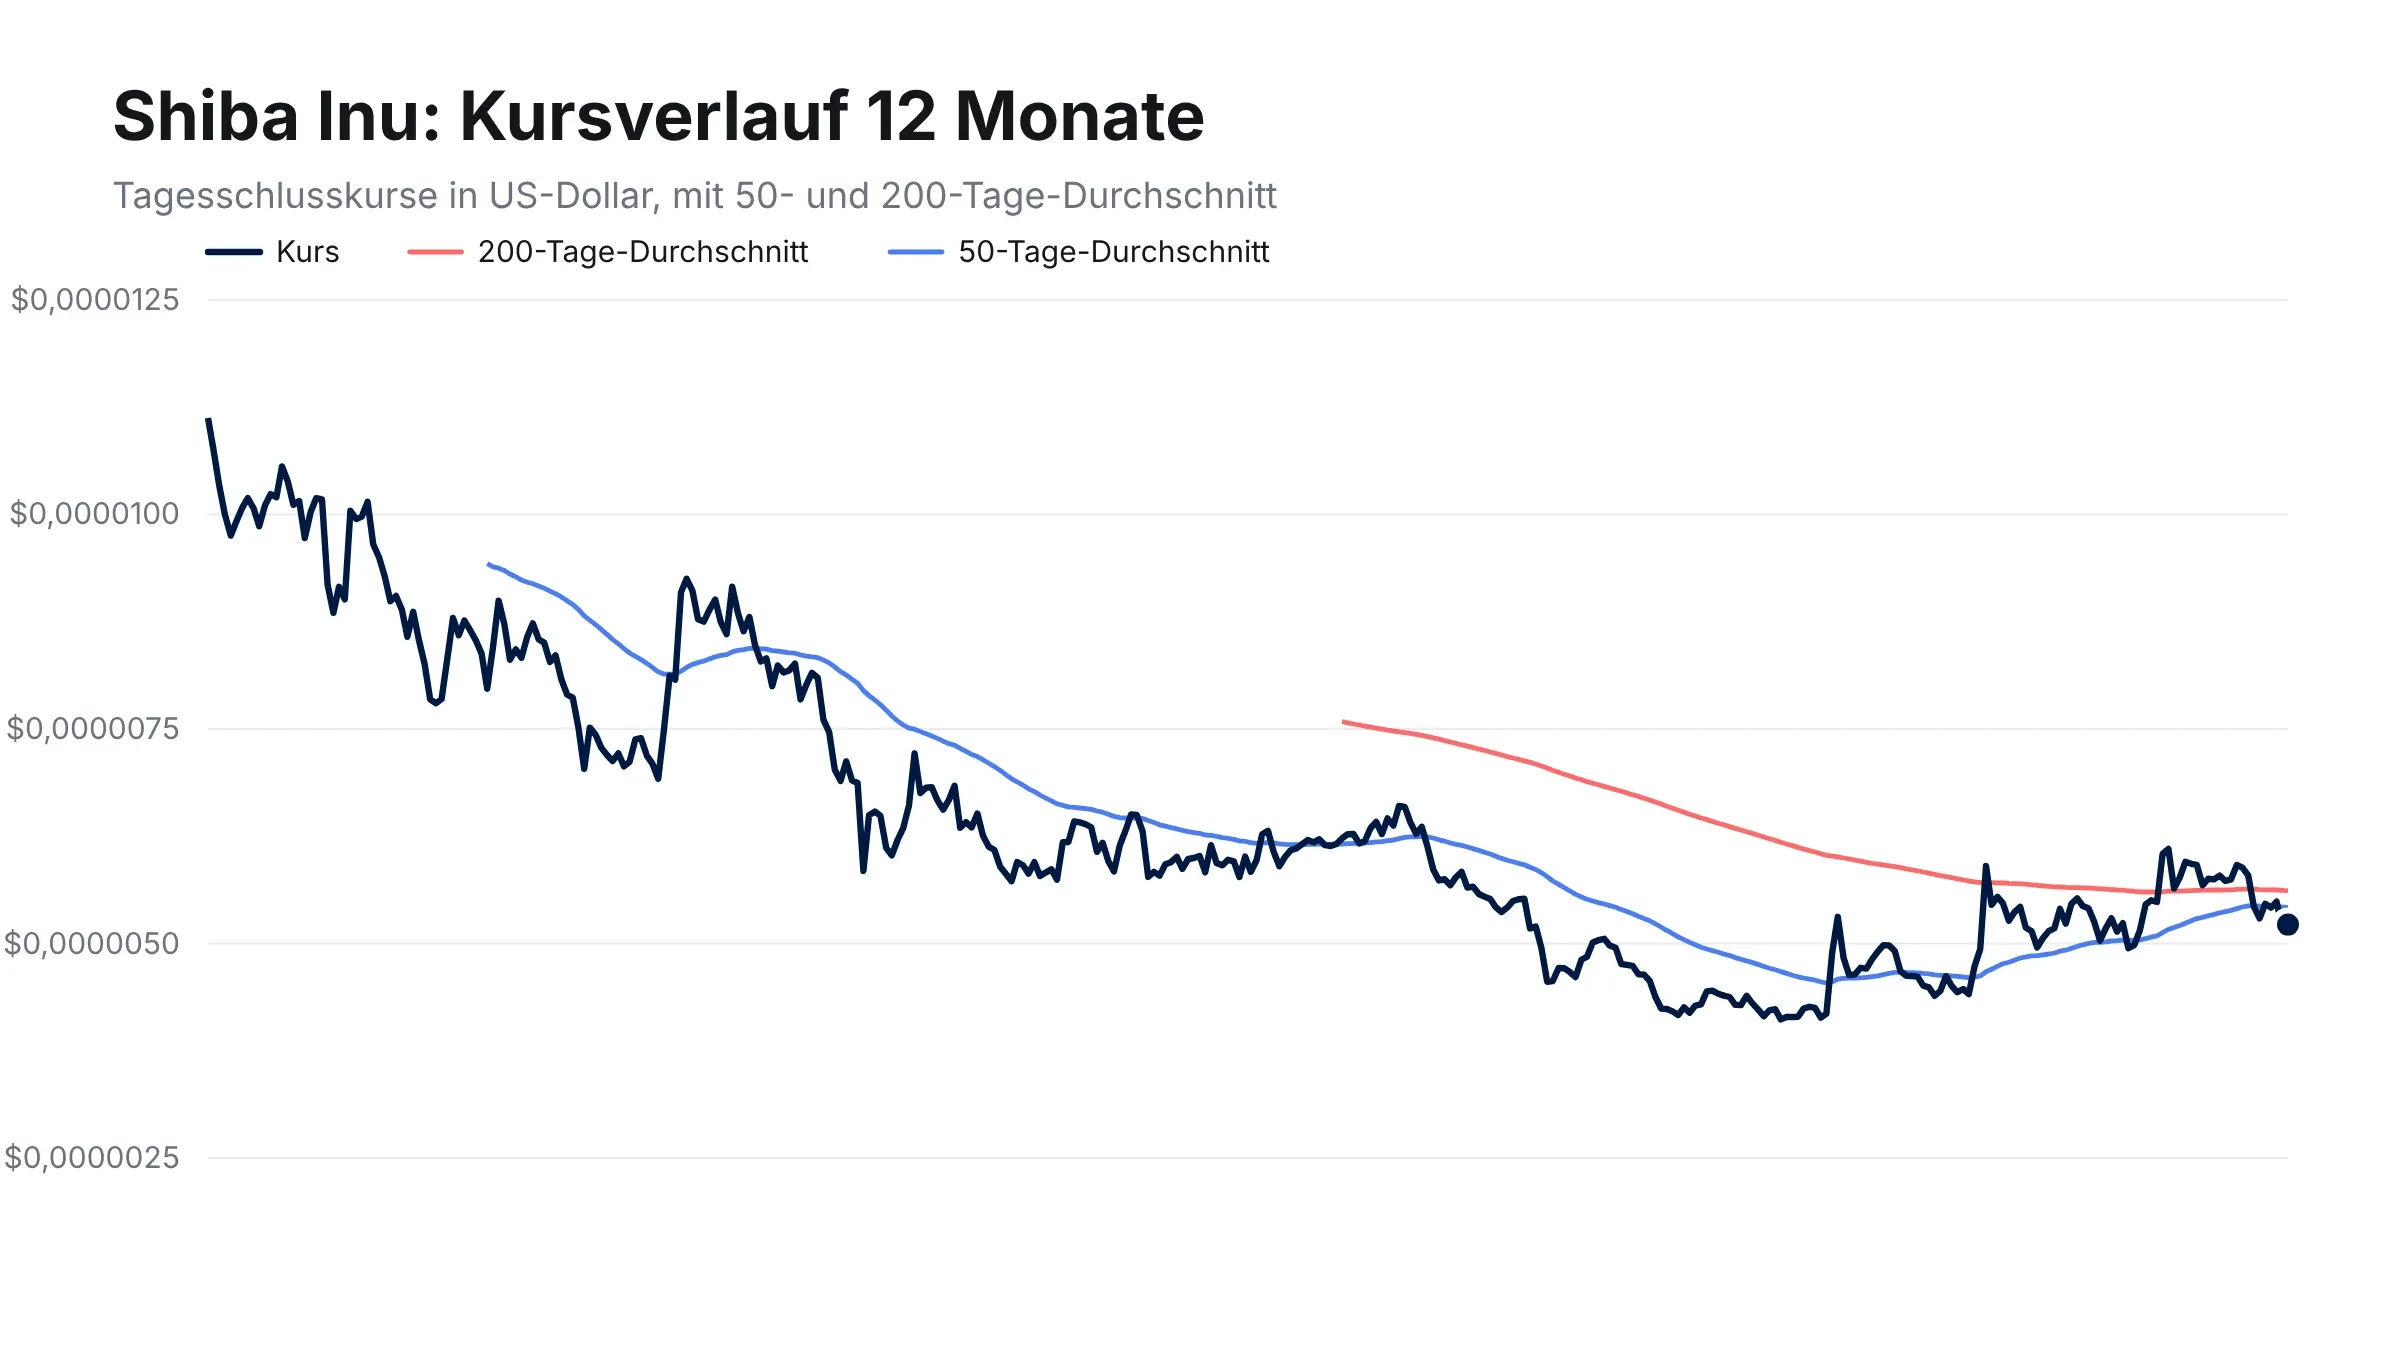
The September recovery has been given back in full
The annual picture removes the last doubt. Twelve months ago SHIB stood at $0.00001112, which is also the high of the past 365 days. Today it is $0.00000521, 53 percent less. The annual low is $0.00000411.
More telling than these extremes are the two moving averages we calculated from the same series. The 200-day average stands at $0.00000561, the 50-day average at $0.00000542. The price is therefore 7.0 percent below the long line and 3.6 percent below the short one. With the short line running under the long one and the price under both, the downtrend holds on both time frames.
A moving average is not a forecast. It says at what level the buyers of the past 50 and the past 200 days entered on average. With the price below it, the majority of those buyers sit on a loss, and every recovery runs into willingness to sell.
3.5 against 5.8 percent: Shiba Inu trades thinner than Dogecoin
A second reference point beyond the chart comes in here, and it explains why SHIB falls harder than its larger relative on weak days. We calculated the turnover ratio of both meme coins, that is trading volume over the past 24 hours divided by market capitalisation.
Shiba Inu comes to $107.0 million in volume on $3.07 billion of market value, which is 3.5 percent. Dogecoin comes to $760.7 million on $13.22 billion, which is 5.8 percent. In a single day Dogecoin therefore turns over 1.65 times what SHIB moves relative to its size. Both figures date from October 13 and come from the same source, so they are collected on a comparable basis.
The practical effect shows up as soon as larger amounts are moved. A thin turnover ratio means the same order shifts the price further. SHIB lost 2.7 percent this Tuesday, while Dogecoin at $0.084533 gave up only 0.9 percent. To buy or sell in this situation, a limit order serves you better than a market order, and the order book depth of your crypto exchange is worth a look first. With a price carrying eight decimal places, the smallest tradable price increment helps decide what an order actually costs.
What has changed since the article of October 12
Yesterday this space covered a fake SHIB airdrop that a community member exposed as a wallet drainer. The price was still at $0.00000549 at publication. Since then 6.0 percent has been given up, and the $0.0000055 level, which had held twice on October 10 and October 12, has broken.
The two events are not connected. A drainer attempt does not move a price of this size, and there is no indication that the ploy succeeded. The chart alone has changed: two defended days have turned into a break, and the next floor lies lower.
These two levels carry the rest of October
On the downside the September low of $0.00000494 counts. It is the lowest value of the past five weeks and sits 5.2 percent below today’s price. An event stands behind that level: on September 16 buyers stepped in there, and the recovery began.
On the upside the October high of $0.00000592 from October 5 counts. It lies 13.6 percent above today’s price and almost coincides with the 200-day average of $0.00000561. The band between $0.0000056 and $0.0000059 is the zone SHIB would have to reclaim for the monthly balance to mean something again.
Between them lies the level that broke today. $0.0000055 held three times in October and counts as resistance from now on, no longer as a floor. To track the levels yourself, take the same daily series and mark the high and the low of the past 35 days instead of round numbers.

For the tax office the purchase date counts, not the price
A distance of 93.9 percent from the record means most SHIB holdings from 2021 and 2022 sit deep in the red. Whether that loss exists for tax purposes at all is decided in Germany by the purchase date alone.
The legal basis is section 23 paragraph 1 number 2 of the German Income Tax Act, the private disposal transaction. Hold a cryptocurrency for more than a year and then sell, and the gain is free of tax. The flip side of the same rule is rarely mentioned: once the year has passed, a loss is irrelevant for tax as well. It can no longer be offset against anything.
A sale inside the one-year period, by contrast, falls into taxable territory. There an annual exemption threshold of €1,000 applies, and it covers all private disposal transactions together rather than crypto assets alone. Exceed it and the entire gain is taxable, not only the part above the threshold. A tax tool or portfolio tracker assigns your purchases by the method the tax office expects, usually first in, first out.
Losses inside the year and how they are offset
Losses from private disposal transactions are trapped in a world of their own. They can be offset solely against gains from other private disposal transactions; salary, interest and share gains stay out of it. Gains from other crypto assets in the same year qualify, and so does a gold sale inside the one-year period.
If a loss remains at year end, it is not lost. It is assessed separately and carried forward into coming years, where it is offset against future gains of the same kind. The condition is that it is declared in the tax return. A loss that is not declared does not exist for the tax office.
That is why this topic belongs in October rather than December. Eleven weeks remain until December 31. Sorting now which SHIB tranches still fall inside the one-year period leaves time for a decision, instead of one that has to be taken between the holidays. From the day a tranche turns one year old the question is off the table, and its loss can no longer be used for tax.
None of this is a recommendation to realise losses. A sale for tax reasons can be economically wrong if it breaks up a holding someone meant to keep anyway. Checking the data, by contrast, costs nothing.
The sources and the calculation
All price figures in this article come from CoinGecko, the daily series from its interface for historical market data, the current prices from the market query for Shiba Inu and Dogecoin. The moving averages and the turnover ratios were calculated by us from those series rather than taken over. Rebuilding them takes the daily closing prices of the past 365 days and a spreadsheet.
Two points belong with that. The price on a single exchange always differs from an average across many exchanges, with SHIB in the eighth decimal place and therefore visibly so in percentage terms. And an exemption threshold is not a flat withholding tax: gains inside the one-year period are taxed at the personal rate, not at a flat 25 percent. Both points are regularly miscalculated in forums.
Our assessment of the situation at Shiba Inu
From the newsroom’s point of view, today’s daily reading is the weaker of the two signals. A price in a downtrend marking a five-week low is the normal case. The turnover ratio of 3.5 percent against Dogecoin’s 5.8 percent weighs more, because it is not a day’s event but a structure. As long as SHIB carries markedly less turnover relative to its size than its closest comparison, every weak market day hits harder here.
Against that stands the monthly balance. A loss of 0.5 to 1.5 percent over 30 days is a quiet number for a coin of this volatility, and the September low of $0.00000494 has held so far. A break of that level would be the signal that invalidates the quiet monthly figure. Until then the picture describes a downtrend with intact support, not a collapse.
None of these observations is an argument to buy or to sell; both only describe what the next move can be measured against. As always with crypto assets, a total loss is possible.
Shiba Inu in October: only above $0.0000059 does the balance turn
- Sort the purchase data. Collect every SHIB tranche with its purchase date and purchase price and mark which of them still falls inside the one-year period on December 31. A portfolio tracker with a tax function takes over the first in, first out allocation.
- Settle the order route. With a turnover ratio of 3.5 percent, spread and order book depth are worth a look, and a limit order protects against a market order slipping. Which providers in Germany charge what is shown by the comparison of crypto exchanges.
- Decide on custody. Holdings meant to sit for several years do not belong on an exchange. Letting the one-year period run deliberately means planning the move to a hardware wallet and keeping the records of the transfer.
(As of October 13, 2026. This article is not investment advice. Prices and fee structures change; check the terms with the provider before you buy. Statements on taxation are not tax advice and do not replace a review of the individual case.)






Be the first to comment