


What to know:
- Decentraland (MANA) gained over 14% in 24 hours, testing a key resistance level that could determine its next major move.
- Analysts expect a breakout above resistance to target $0.12, $0.16, $0.21, and $0.26, signaling a potential trend reversal.
- Technicals remain mixed, with Bollinger Bands showing pressure while the MACD suggests selling momentum is easing.

Decentraland (MANA) is testing a crucial resistance level after a prolonged downtrend, with rising bullish momentum hinting at a possible trend reversal for the MANA price. Analysts await breakout confirmation, while technical indicators remain cautious, showing persistent bearish pressure despite signs that selling momentum is beginning to weaken.
At the time of writing, MANA is trading at $0.07257 with a 24-hour trading volume of $74.81 million and a market capitalization of $74.81 million. Following the 14.14% gain over the last 24 hours, the MANA price structure points to a bullish reversal ahead.

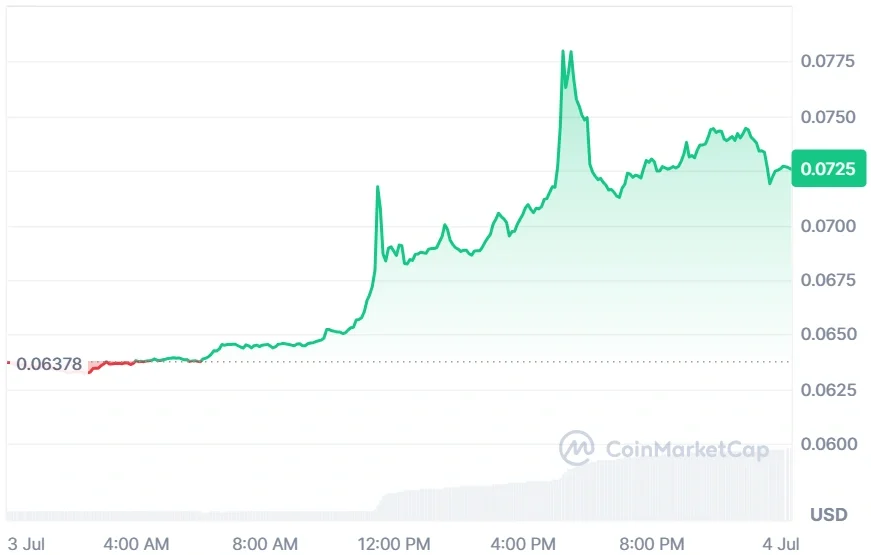
Source: CoinMarketCap

Also Read: Decentraland Price Prediction: MANA Eyes Breakout as Buying Pressure Builds Near Key Support
MANA Price Breakout Could Trigger Next Move to $0.26
Furthermore, the crypto analyst Crypto Hunter Arab highlighted that the MANA price is approaching a critical technical level after months of trading within a prolonged downtrend and accumulation range.
The token is now testing a major resistance zone, with growing bullish momentum suggesting buyers are attempting to regain control. A confirmed breakout could signal the beginning of a broader trend reversal and renewed market confidence.


Source: Crypto Hunter Arab’s X Post
With strong trading volume, if the MANA price overcomes resistance, further levels of upside targets by analysts would be $0.12, $0.16, $0.21, and even $0.26.
Confirmation is expected from traders before declaring an uptrend as sustainable, but with current developments, there may be expectations for a major bull run on this cryptocurrency.
Technical Indicators Point to cautious Outlook
According to TradingView, the MANA price chart indicates a negative trend for the asset on the larger macro level.
After peaking at the $0.80000 level in 2024, the MANA price drifted into a negative downtrend. It finally crossed some important support lines by 2026 and saw a steep fall. MANA is currently trading at $0.07051.

Source: TradingView
From a technical point of view, the Bollinger Bands trap the price touching the lower band at $0.04949 below the $0.10229 reference level, indicating an aggressive decline in prices. However, the MACD lines are comfortably below zero levels. On the other hand, a small green tick in the histogram valued at 0.00270 indicates a slowdown in the fall.
Following the changing market conditions and bullish price predictions, the MANA price has performed well and surged 14%. This happens because BTC has started to move in an upward direction, impacting the overall market, including altcoins.
What Happens Next?
The MANA’s next move is dependent upon whether the buyers manage to break the price through the resistance level with good volume.
Breaking out will increase bullish sentiment and open doors for a rise to the subsequent resistance levels of $0.12, $0.16, $0.21, and $0.26. Conversely, if MANA fails to break this resistance level, it will continue to remain stuck in its broader downtrend.
This article contains market analysis and price predictions. These are not guarantees. Crypto markets are volatile. Always DYOR. Not financial advice.
Also Read: Decentraland (MANA) Breaks key pattern, Targets $0.58 Amid Bullish Momentum

Be the first to comment