



Near Protocol [NEAR] reached a price high of $6.00 on Monday, the 12th of October. This was the highest the altcoin has reached since January 2025.
The altcoin had been trading under $2 in the second half of August. Buoyed by the crypto market sentiment shift in August and the increased capital flow into the crypto AI sector, NEAR token prices surged 283% in under two months.
The past week’s pullback measured 5.4% so far. The $4.45-$4.70 local support zone appeared likely to be tested once again. The Sunrise and Near Intent partnership was not enough to overcome the profit-taking pressure in the market.
Sell signal for NEAR?
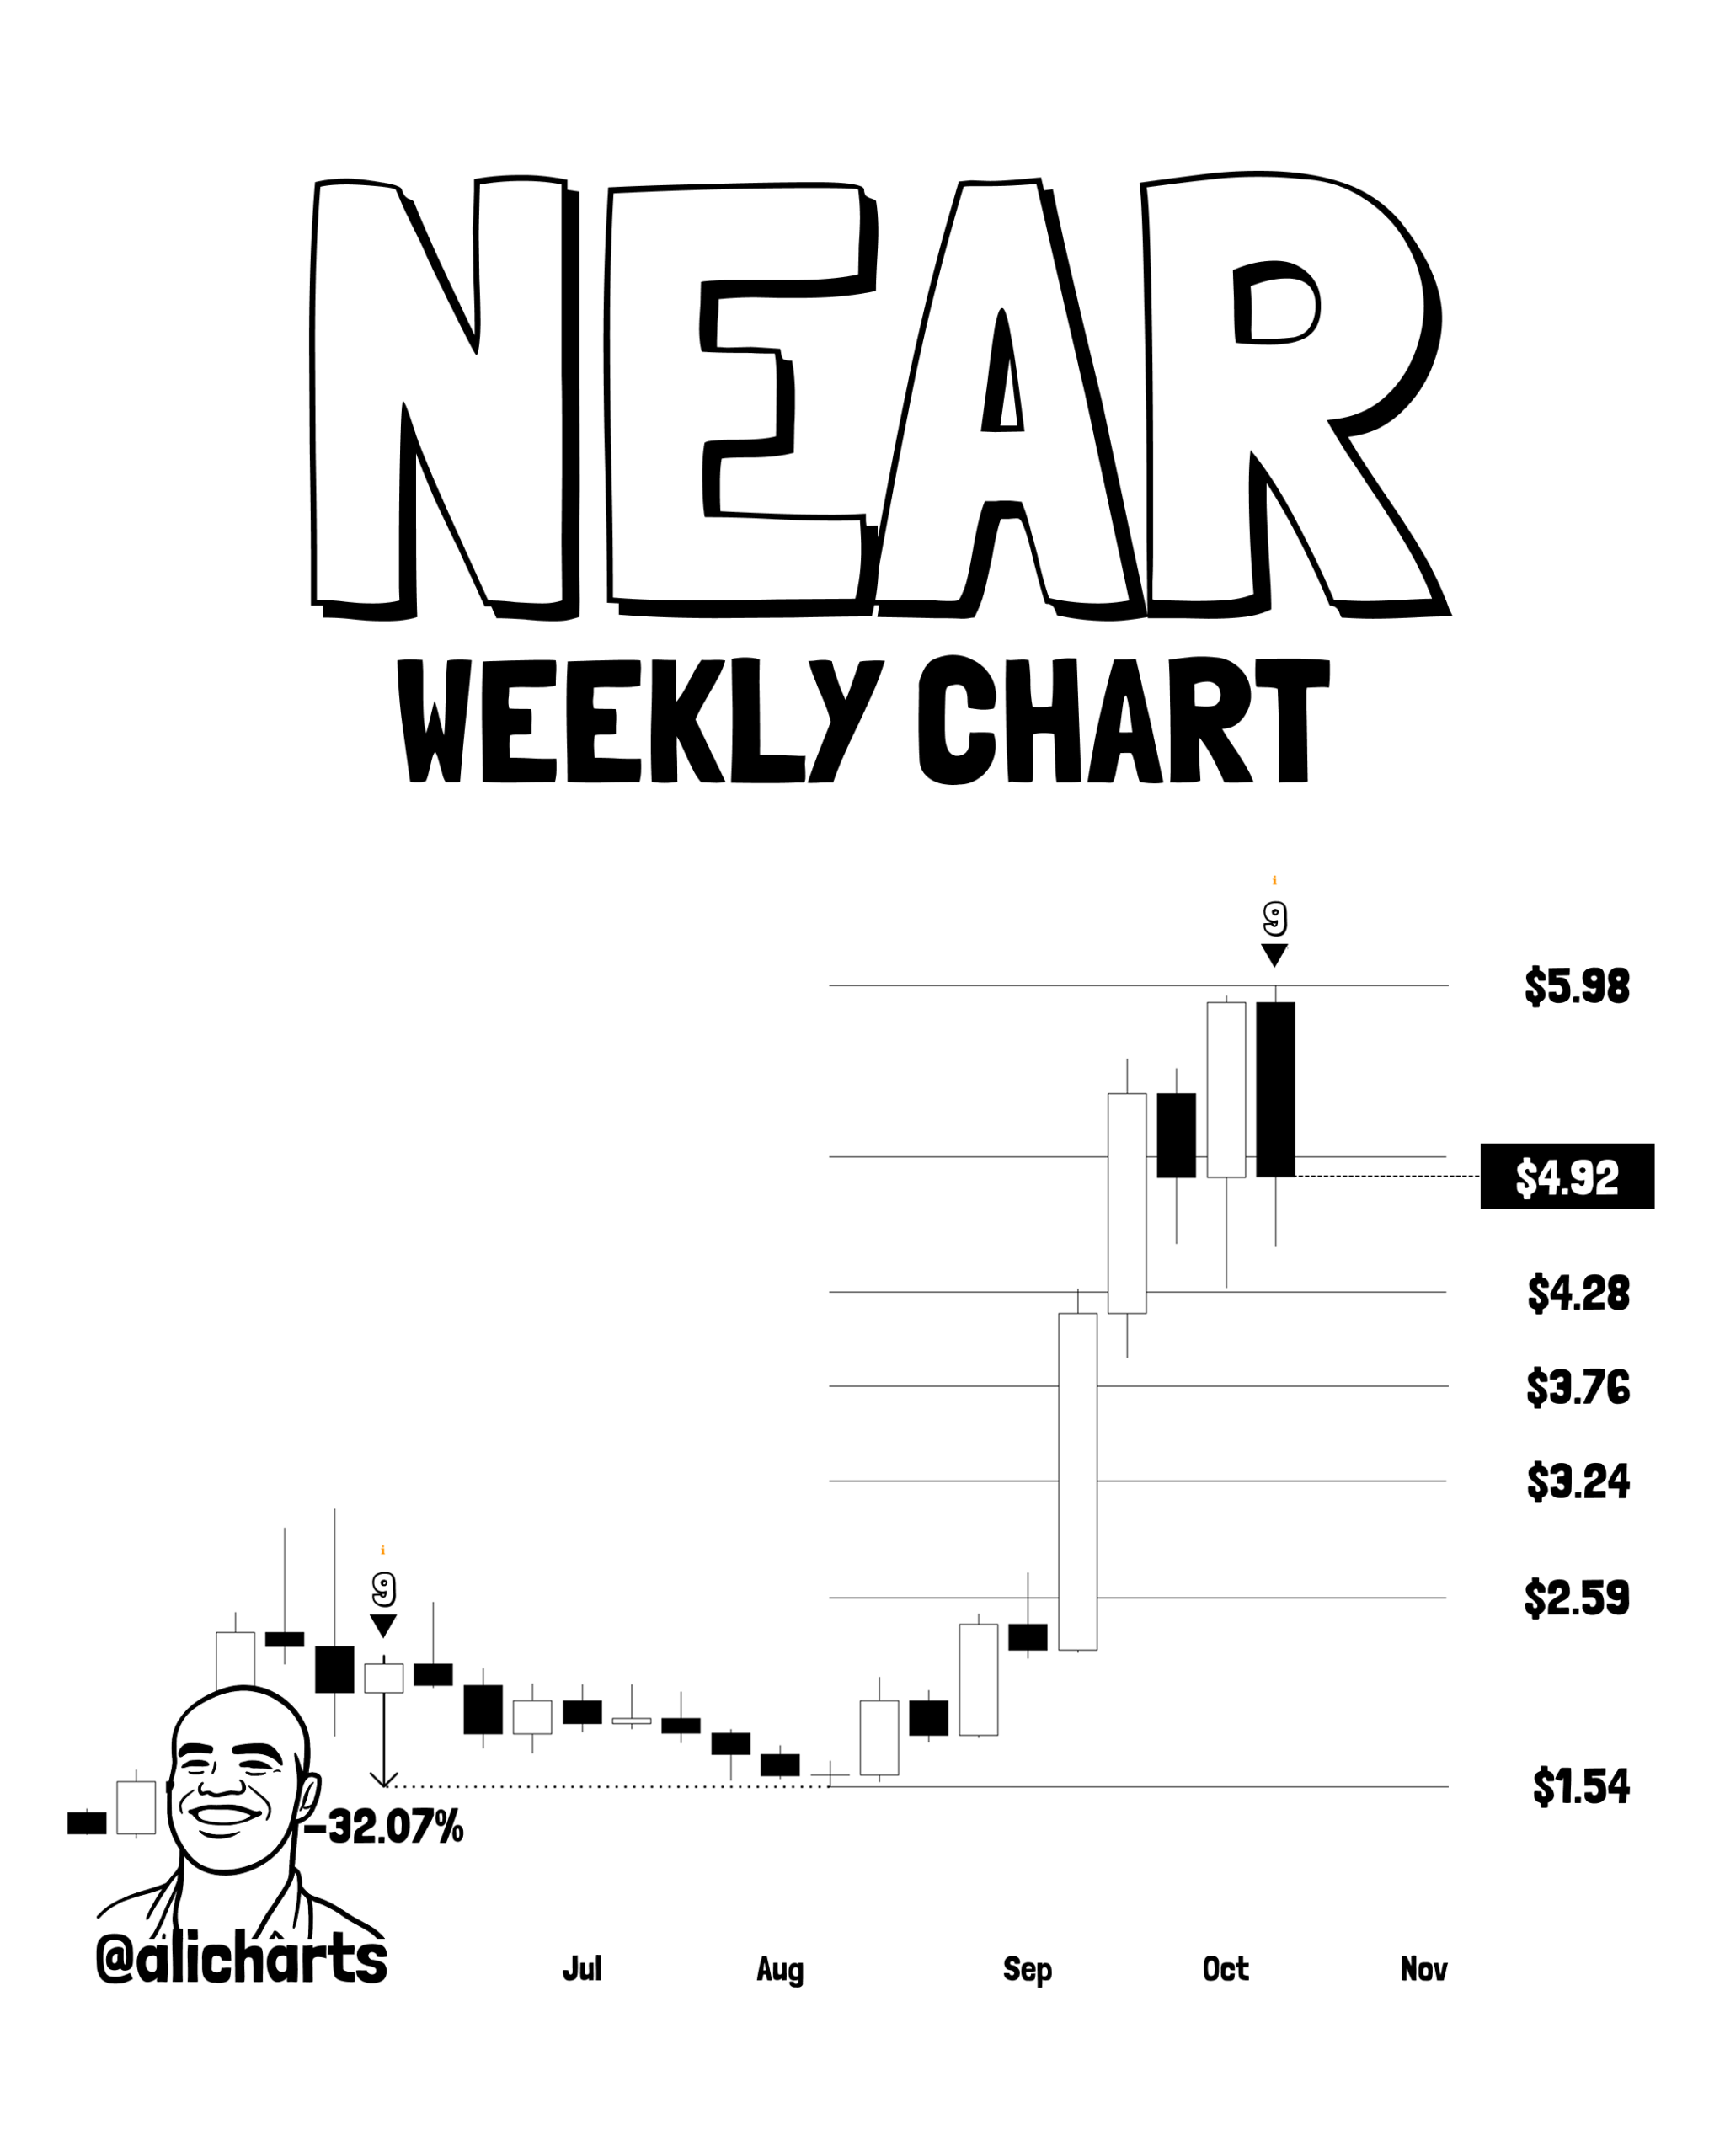
Popular crypto analyst Ali Martinez showed that the weekly Near Protocol chart exhibited a sell signal on the TD Sequential. The previous time a comparable sell signal occurred, a 32% price correction commenced for the altcoin.

The analyst highlighted the $4.30 level as a key support, the failure of which could take NEAR down to $3.76.
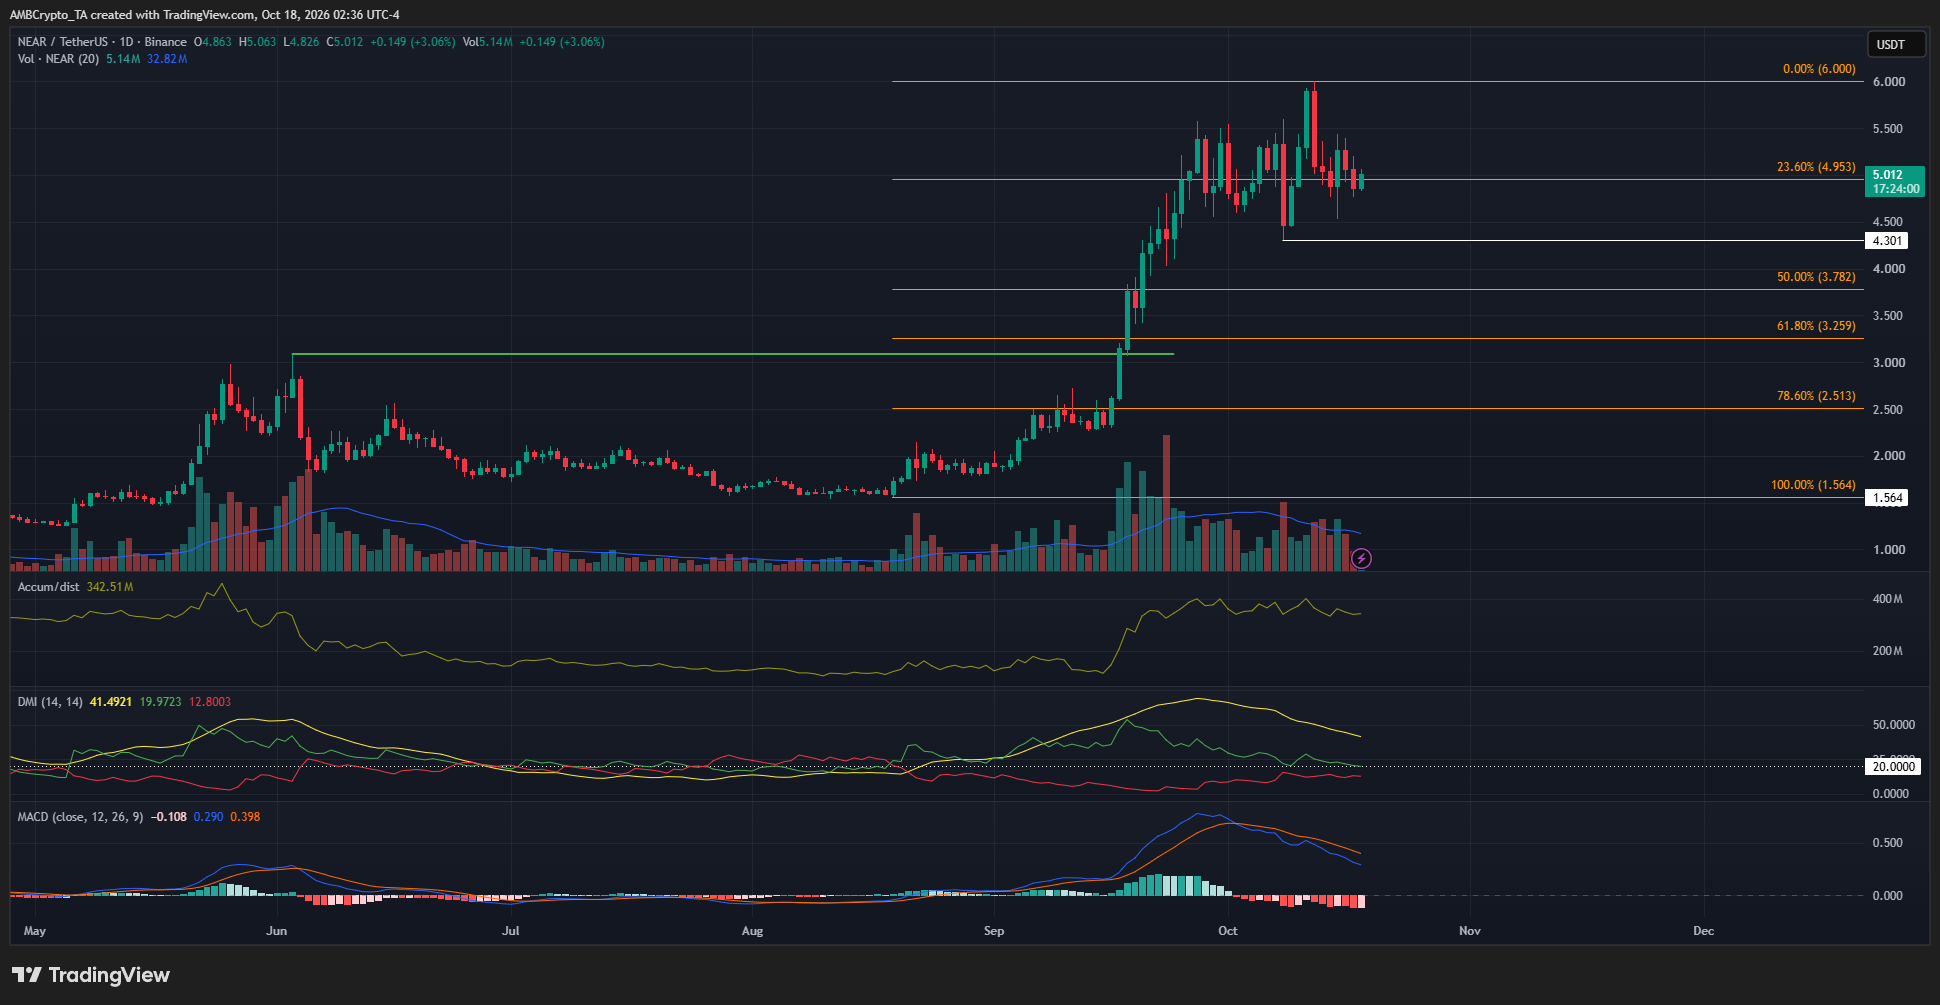
The $4.30 local low made earlier in October kept the lower timeframe price trend bullish. On the 1-day chart, the swing structure was bullish. Even a retracement as deep as $2.51 might be nothing more than a healthy, albeit severe, correction.
The A/D indicator has moved sideways in recent weeks, and the DMI showed that the uptrend on the daily timeframe was losing strength. The MACD also cautioned of a pullback.
The rapid pace of the upward price expansion of the past two months meant that there were no significant consolidation phases that can be taken as obvious demand zones.
The Fibonacci retracement levels were one way for long-term buyers to assess a buying opportunity.
Short-term NEAR price prediction
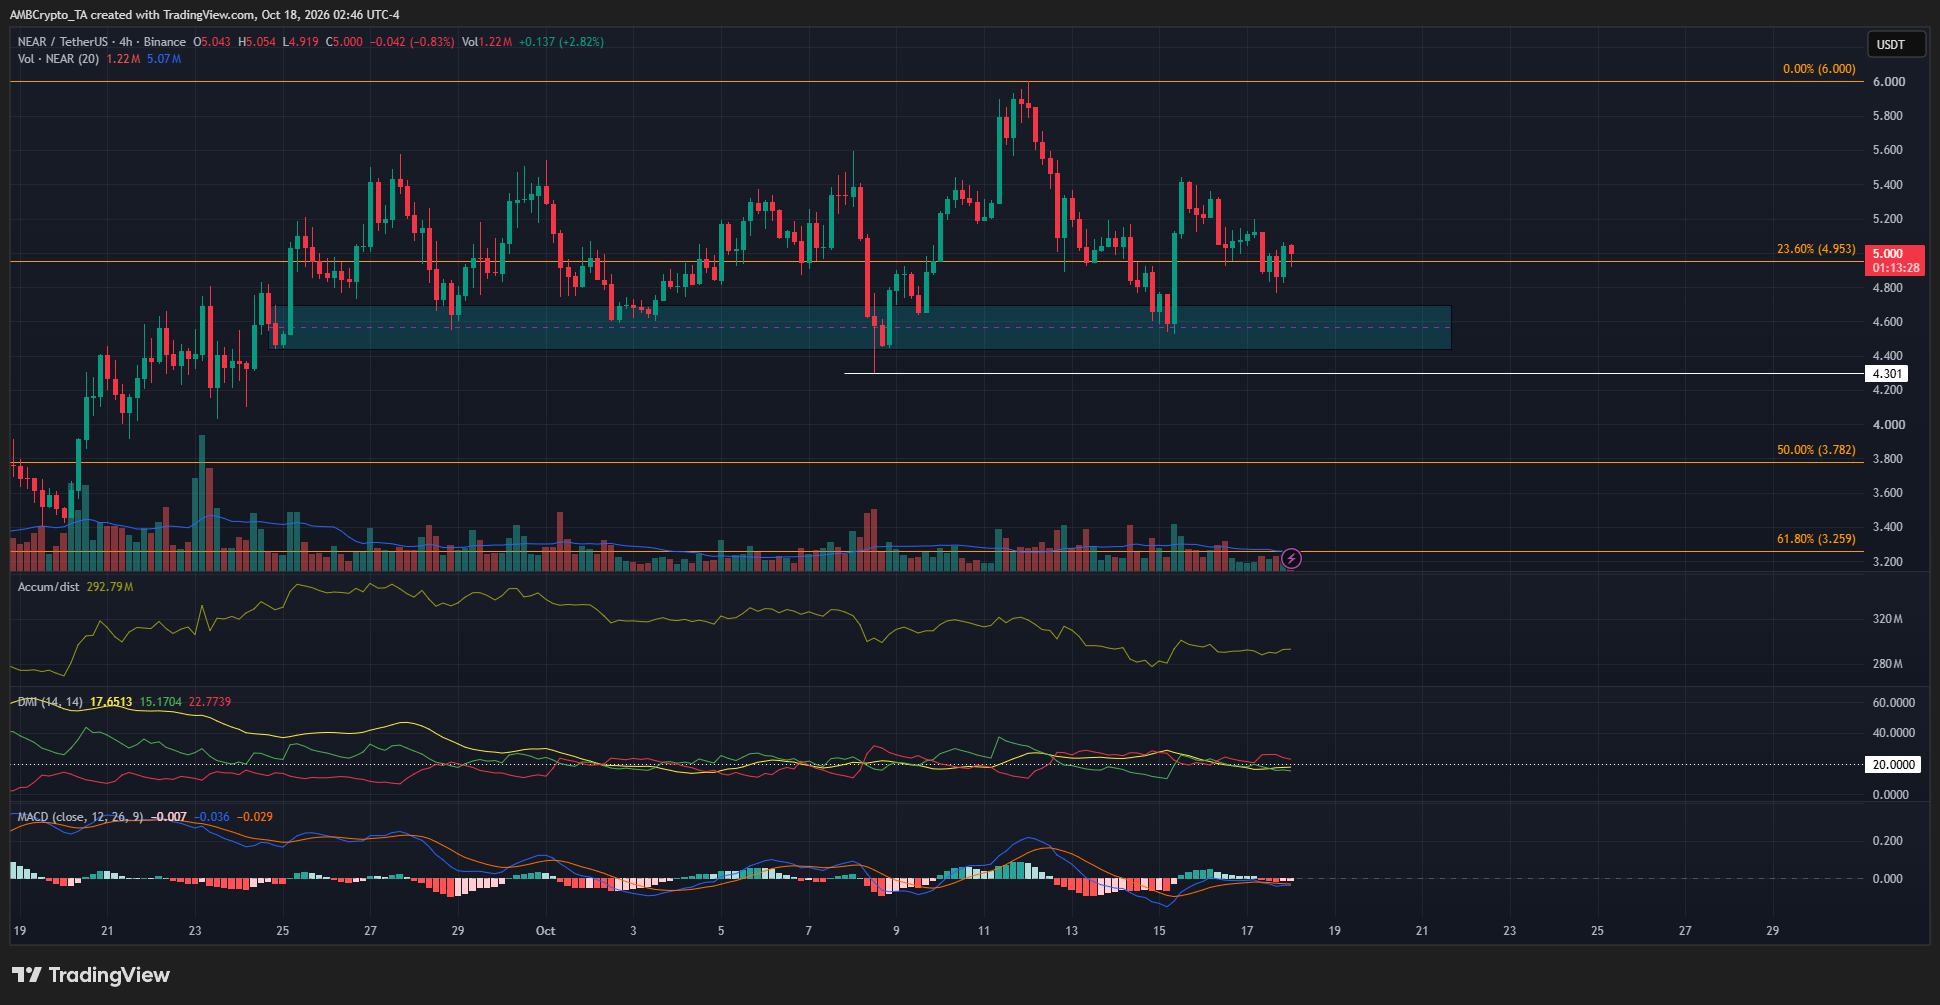
The 4-hour chart highlighted a key local demand zone at $4.60. So far, the altcoin has respected this zone. Repeated tests of this area since late September has not yielded a breakdown.
A 4-hour session close below $4.30 would be the first sign of a deeper pullback. Meanwhile, a move past $6.0 will signal a bullish continuation.
Final Summary
- The Near Protocol bullish trend strength from August appeared to have weakened and could give way to a price correction.
- In the coming days, the $4.30 support is one to watch. Long-term investors can find value in a correction as deep as $2.51-$3.26.


Be the first to comment