



Once again, XRP is getting close to one of its most crucial levels of psychological support. The asset broke out of a tightening symmetrical triangle and is currently trading close to $1.06, putting the $1.00 threshold firmly within reach after failing to maintain its most recent recovery attempt.
XRP is unable to withstand the pressure
The next significant move could see XRP testing a level it has been able to defend throughout the second half of 2026 unless buyers intervene swiftly. After a few days of compression between converging trendlines, the most recent breakdown occurred. XRP eventually lost support, confirming bearish momentum rather than a continuation of the recent bounce, even though such patterns can resolve in either direction.
Selling pressure increased noticeably in tandem with the breakout, giving the move more legitimacy. Over almost all time periods, the technical picture is still poor. The 20-day, 50-day, 100-day, and 200-day exponential moving averages are all still above where XRP is trading, indicating a clear bearish trend.

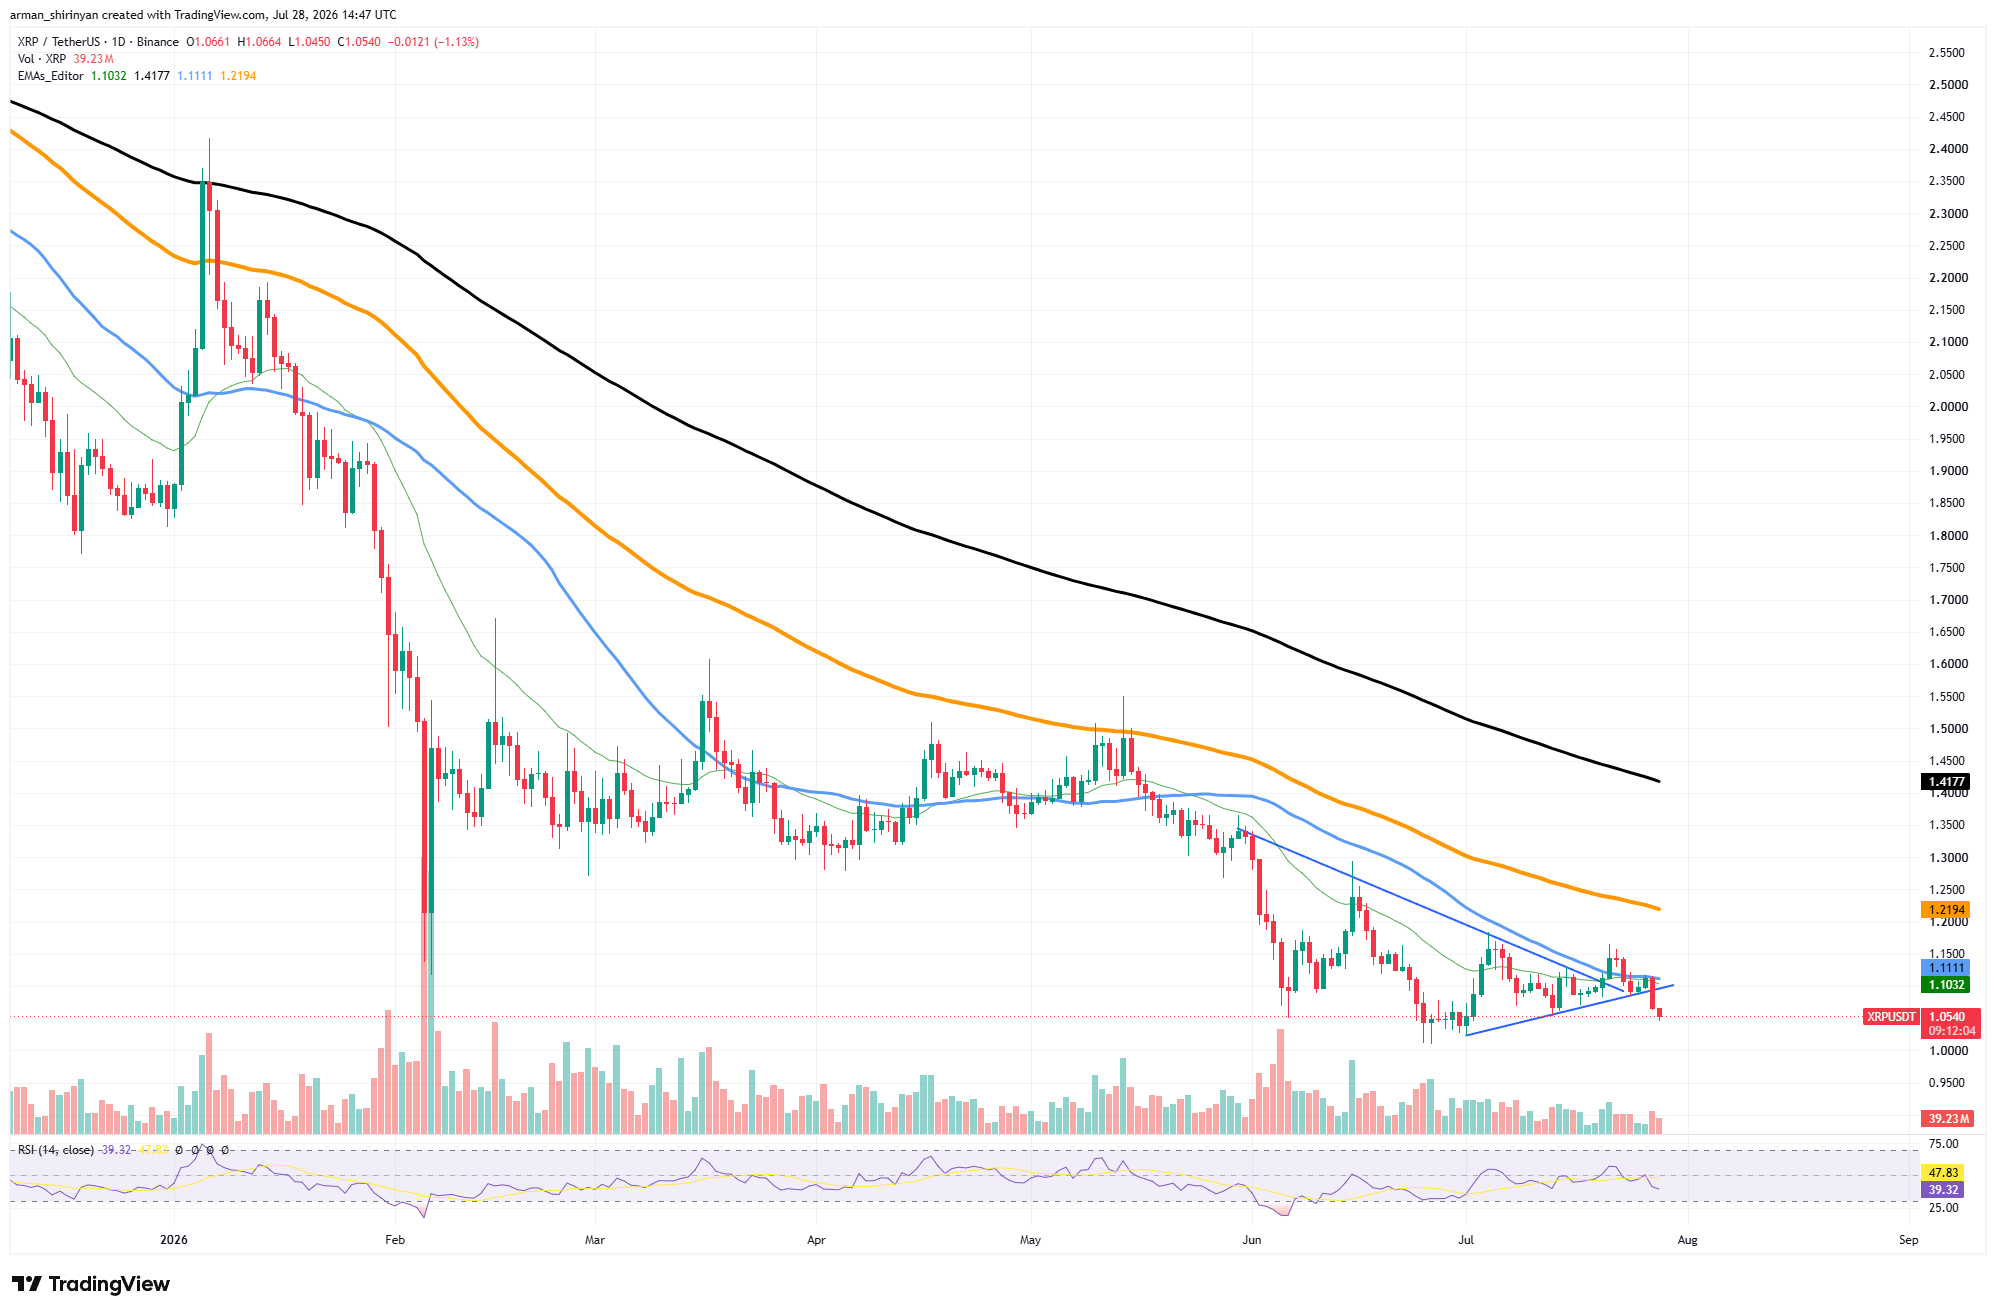
More significantly, buyers have been prevented from gaining sufficient momentum to reverse the market structure by the 20-day EMA acting as dynamic resistance once more. The first support is currently located around $1.00, a level that is both technically and psychologically significant. When stop-loss orders are activated and market sentiment worsens, losing it would probably hasten selling activity.
You Might Also Like

If the $1 barrier fails, there isn’t much structural support because the next significant support doesn’t show up until about $0.95 below that. On the plus side, before any recovery could be deemed credible, XRP would need to reclaim the 20-day EMA around $1.10. Even so, the first significant barrier bulls would have to get past in order to reverse the medium-term trend is the 100-day EMA at $1.22, which remains a much stronger resistance level. Additionally, momentum indicators advise caution.
The RSI has dropped to about 39, which suggests that buying pressure is waning without yet reaching extremely oversold levels. In other words, there is still potential for the market to drop before technical exhaustion turns into a strong bullish argument.
The recent consolidation has seen comparatively low trading volume, indicating that neither buyers nor sellers made significant commitments prior to the most recent breakdown. Because of this lack of conviction, markets are frequently exposed to more aggressive moves once support levels collapse.
Ethereum’s rise continues
Despite a slight decline, Ethereum has continued to rise; the second-largest cryptocurrency is currently trading slightly below $1,900 and is setting itself up for another attempt to reclaim $2,000.
ETH has established a series of higher lows after recovering rapidly from the capitulation lows in June, indicating that buyers are still in control even as the market pauses beneath a significant resistance zone.
The 100-day exponential moving average, which has once again capped the most recent rally at $1,930, is the most immediate obstacle. Ethereum made a brief intraday surge above the level but was unable to achieve a strong breakout, indicating that sellers are still actively defending the area.
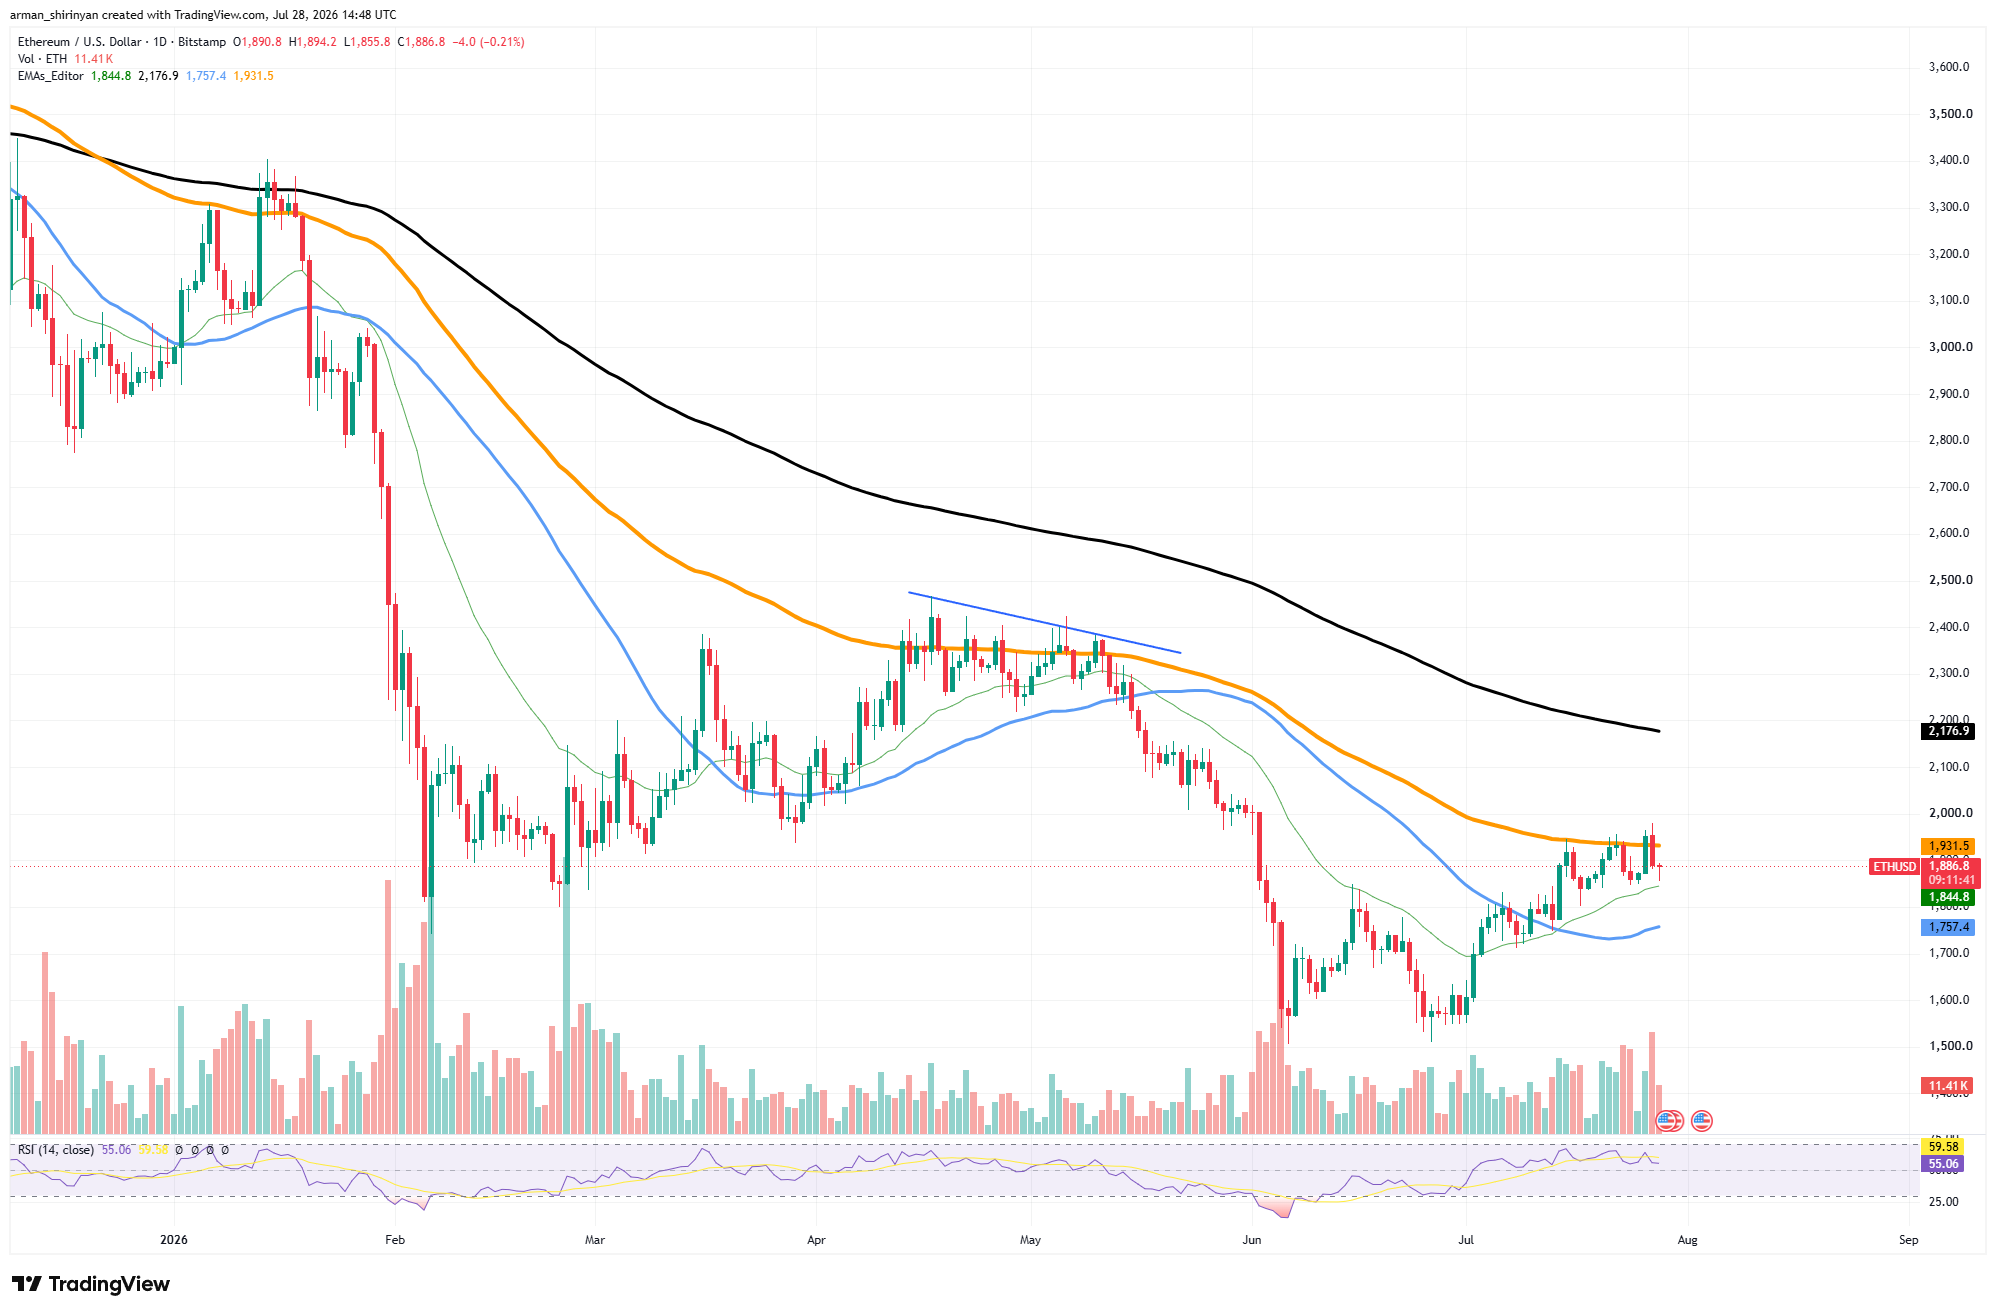
Nevertheless, the price has remained comfortably above the rising 20-day EMA at $1,845, indicating that the rejection has been rather shallow. That is a positive sign for bulls. Ethereum keeps consolidating just under resistance rather than giving back a sizable portion of the recent gain.
When buyers absorb selling pressure before attempting another breakout, this kind of price action frequently indicates accumulation. A clear close above the 100-day EMA would probably draw attention to the psychological $2,000 barrier.
The 200-day EMA around $2,175, which continues to characterize Ethereum’s longer-term decline, is still the next significant technical barrier after that level. It would be the strongest bullish signal ETH has produced in months if both moving averages were reclaimed.
You Might Also Like

Despite the recent slowdown, momentum indicators continue to be positive. The RSI is still well below overbought levels, but it is comfortably above neutral territory at 53. This implies that Ethereum still has potential to rise further without experiencing the momentum exhaustion that is usually brought on by intense rallies. Throughout the recovery, volume has also remained comparatively stable.
Although buying activity has decreased in comparison to the sharp recovery from June’s lows, it still supports the string of higher lows that have emerged over the last few weeks. The 20-day EMA around $1,845 is the crucial support to watch. The current recovery structure is unaffected as long as Ethereum stays above that threshold. A break below it would probably push the asset closer to the 50-day EMA at about $1,757, where buyers would be put to the test in a more significant way.
Near Protocol’s rally is over
The technical framework that helped Near Protocol (NEAR) recover over the last two months has officially been lost. The token broke below its main support cluster after consolidating above important moving averages for a few weeks, ending the previous uptrend and reversing momentum in favor of sellers.
NEAR moved decisively below the 20-day, 100-day, and 200-day exponential moving averages with the most recent decline, pushing it to about $1.63. Throughout July, a strong technical floor was created as those averages converged between $1.81 and $1.88. The asset cut through all three levels in a single move rather than rising again, indicating that buyers are no longer in control of the short-term trend.
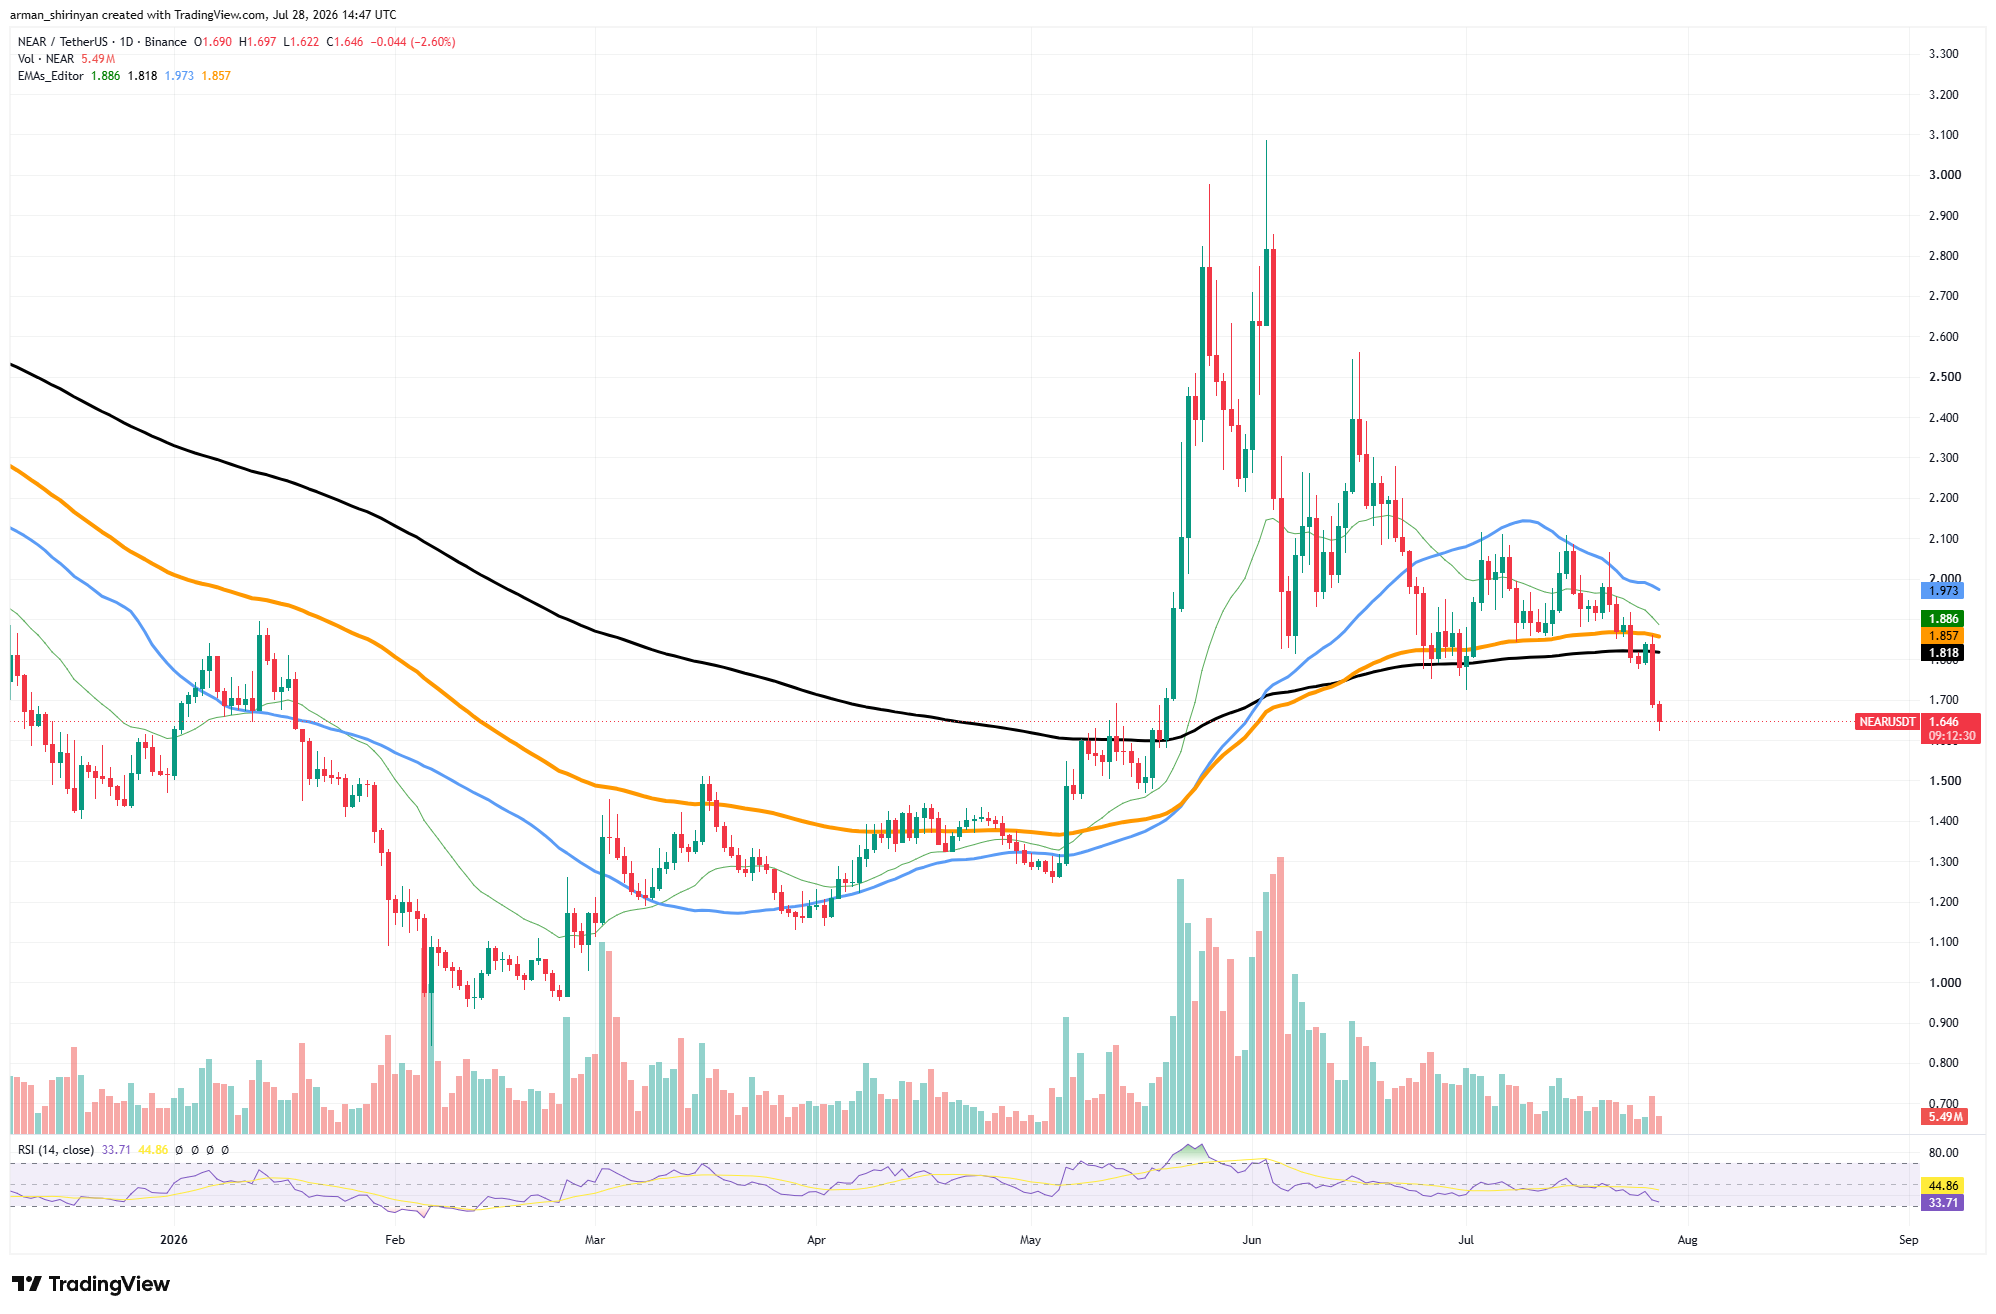
Because NEAR had been forming a comparatively stable consolidation following its explosive rally in late May and early June, the breakdown is especially significant. The token briefly surged above $3 during that rally, but momentum gradually waned and each subsequent attempt at recovery resulted in lower highs. The most recent sell-off appears to complete that downward trend.
The 200-day EMA, which frequently divides long-term bullish and bearish conditions, has now failed to hold as support. Losing that level is rarely a good technical signal, especially when there is weakness across shorter-term moving averages as well. Any short-term bounce will probably be viewed by the market as another selling opportunity unless NEAR swiftly reclaims the region above $1.82.
You Might Also Like

Additionally, momentum indicators suggest growing weakness. The RSI has dropped to about 33, which is close to oversold territory but still above the extreme levels that usually lead to more robust relief rallies. In other words, while selling pressure has increased, the chart does not yet show that bears have exhausted themselves.
The fact that volume has not skyrocketed during the breakdown indicates that a lack of buying interest rather than outright panic has been the primary driver of the decline. Demand gradually declines rather than collapsing in a single capitulation event, which is often indicative of trend deterioration.
The $1.50-$1.55 range, which served as resistance prior to the May breakout, is the next support worth watching. NEAR may return to the $1.30 area, thereby erasing a large portion of the summer recovery, if buyers are unable to defend that range. On the plus side, reclaiming the moving-average cluster around $1.82–$1.88 is now crucial.
Consistently moving back above those levels would be the only way to refute the current breakdown and rebuild confidence that the broader recovery is still intact. However, the technical data currently favors the bears.


Be the first to comment