


What to know:
- Optimism (OP) shows early breakout signals as price consolidates near $0.12 after breaking key resistance with rising momentum.
- Technical analysis suggests OP is compressing within a descending channel, hinting at a potential bullish breakout formation.
- A confirmed breakout above resistance could push Optimism (OP) toward higher targets, including the $1.30 zone.

Optimism (OP) is moving in a consolidation phase with the breakout in sight as the token has broken above the key resistance with strong momentum. According to CoinMarketCap, the OP price has surged by 1.14% over the last 24 hours but remains down by 2.44% over the last week.
At the time of writing, OP is trading at $0.1247, with a trading volume of $95.62 million, which has surged by 71.02% over the last 24 hours. However, its market capitalization stands at $268.16 million, which is also up by 1.14%.
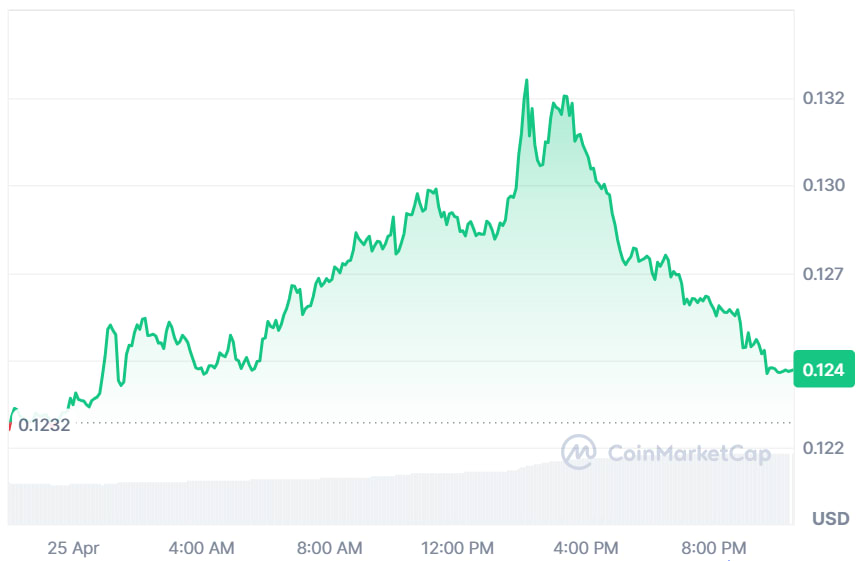

Source: CoinMarketCap

Also Read: Optimism (OP) Descending Channel Retest Could Trigger Major Rally to $1.34
OP Shows Potential Breakout From Downtrend Channel
Furthermore, the crypto analyst Butterfly highlighted that OP is showing early signs of strength on the 3-day chart as price reacts from the lower boundary of a descending channel.
This support zone has consistently absorbed selling pressure, preventing deeper declines. The ongoing compression suggests bearish momentum is fading while buyers gradually step in, stabilizing price action at a critical technical level.

Source: Butterfly’s X Post
In the event that the buying pressure persists, the price action of OP may try to break out of the falling pattern.
This could create significant upward momentum towards the next resistance level near $1.30, indicating a possible change in the short-term sentiment. However, it will be important for the price action to breach the channel.
OP Technical Indicators Point to Bearish Dominance
According to TradingView, there is an evident decline in OP, dropping from above $0.35 in February to establish support at $0.12.
At present, it is currently approaching its upper Bollinger Band resistance at $0.133, while remaining above its middle simple moving average of $0.119. This indicates a shift from negative momentum to one of temporary stability.
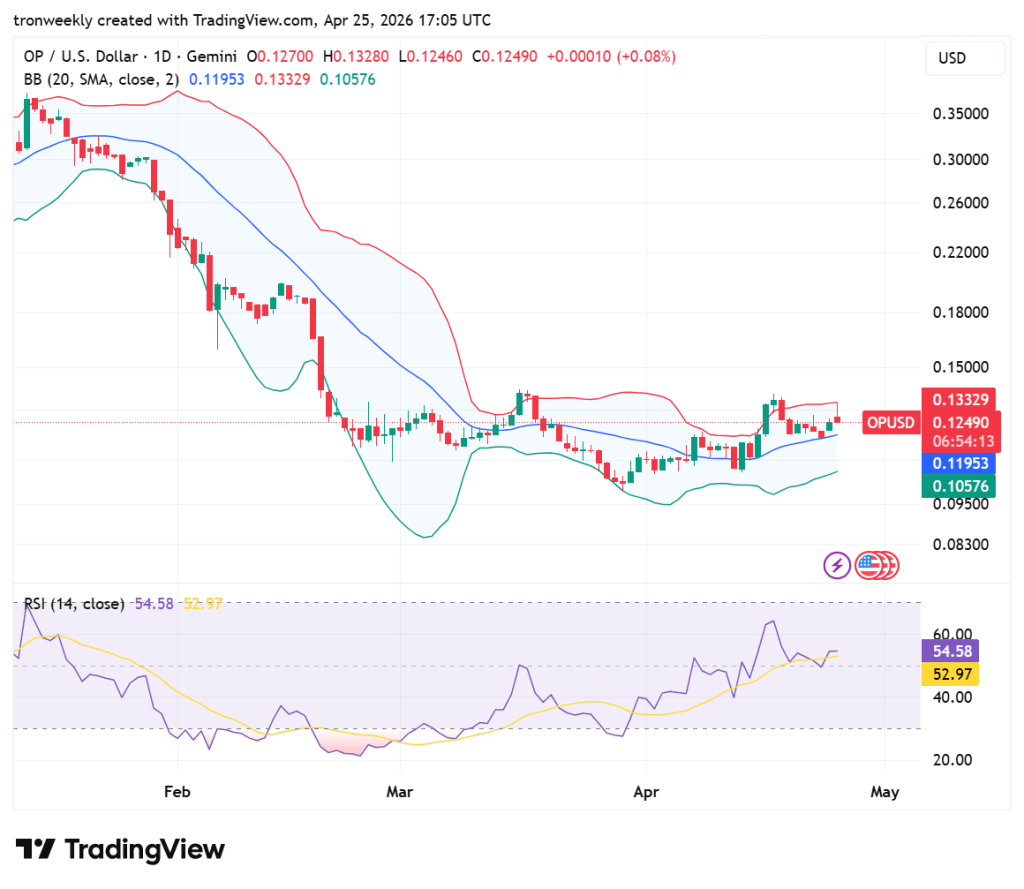
Source: TradingView
The RSI is now trading at 54.58, meaning there is no indication of strength or weakness as the market is not overbought or oversold.
The level is indicative of some improvement in buying interest from the lows experienced in the month of March. The market is waiting for a decisive breakout to determine the trend.
This article contains market analysis and price predictions. These are not guarantees. Crypto markets are volatile. Always DYOR. Not financial advice.
Also Read: Optimism (OP) Shows Strong Bullish Signals With an Explosive Rally Toward $5
Be the first to comment