


What to know:
- OP shows recovery signs after a long-term decline, trading within a key demand zone that may trigger a major reversal
- Technical indicators like RSI (59.83) and bullish MACD crossover confirm growing buyer control and upward momentum
- Analysts highlight a potential breakout structure with upside targets ranging from $0.85 to a speculative $5 cycle extension

Optimism (OP) is moving in a strong bullish trajectory as BTC has started to move in an upward direction. According to CoinMarketCap, the OP price has surged by 8.72% over the last 24 hours and 4.51% over the last week.
At the time of writing, OP is trading at $3.24, with a trading volume of $67.88 million, which has declined by 10.47% over the last 24 hours. However, its market capitalization stands at $257.85 million, which is up by 8.66%.


Source: CoinMarketCap

Also Read: Optimism (OP) Could 40x: Key Accumulation Zone Signals Massive Opportunity
OP HTF Demand Zone Could Push the Price to $5
Furthermore, the crypto analyst Crypto Patel highlighted that OP has undergone a severe multi-year decline, shedding nearly 98% of its value into a high-timeframe demand zone between $0.10 and $0.07.
This macro discount area is often where long-term participants begin accumulating during extreme bearish sentiment, positioning for potential cycle reversals after prolonged downside exhaustion.
Structurally, OP remains inside a long-term descending channel, but price compression is tightening, suggesting volatility contraction and potential expansion ahead.
The key bullish trigger is a weekly close above $0.3764, which would signal a possible shift in momentum. If confirmed, upside targets include $0.37, $0.85, $2, and a speculative $5 cycle extension.


Source: Crypto Patel’s X Post
Although this is the case, there could be substantial risks involved if OP does not receive macro support. A weekly closing below $0.075 would make the bullish pattern invalid and confirm the continuation of the bearish trend. However, due to OP’s correlation with Ethereum’s Superchain theme, it will remain a risky Layer 2 token play.
Momentum Indicators Reinforce Bullish Trajectory
According to TradingView, the value of the RSI (14) stands at 59.83 and is comfortably positioned above the signal line at 50.90.
This signifies the increasing strength of the bulls as they rise up to the overbought level. The fact that it is above the midpoint of 50 means that the bulls are still in charge of the market.
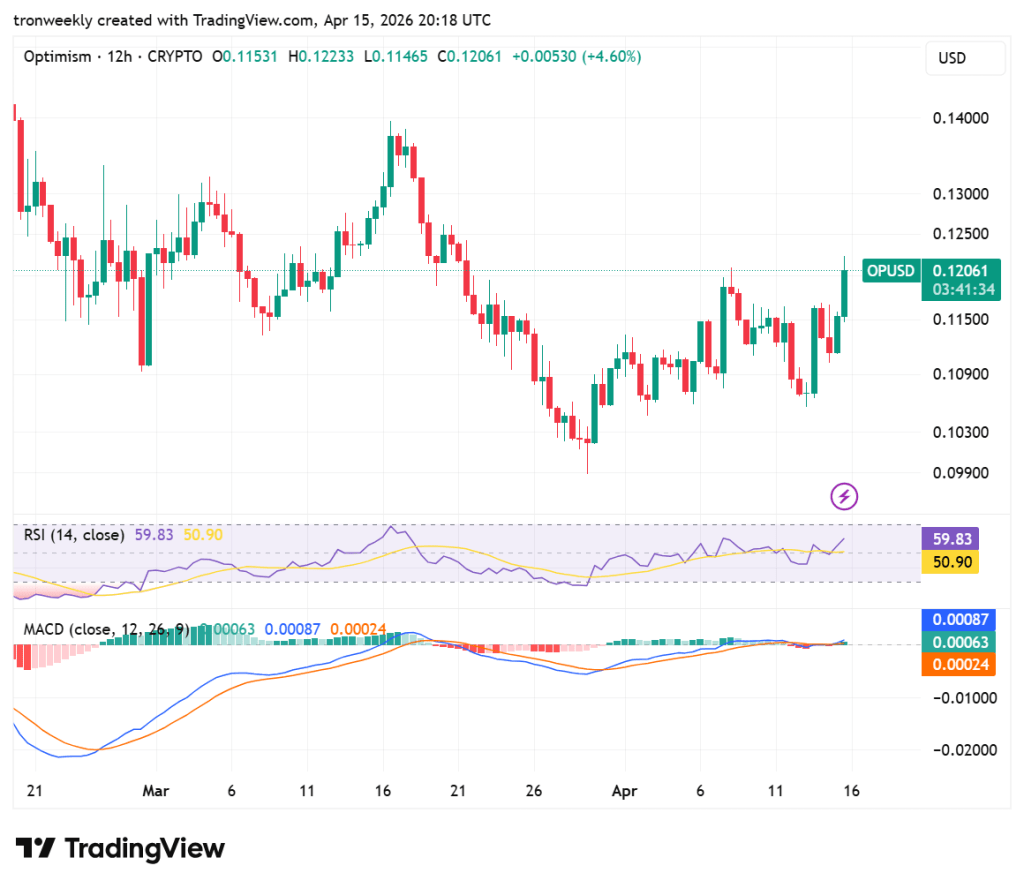
Source: TradingView
MACD is seen showing a bullish setup because the MACD line is trading at 0.00087 and is above the signal line. The histogram is showing a green color due to the increased momentum.
Since the two lines are trading above the zero level, the bullish bias will remain intact as long as the gap between them persists.
This article contains market analysis and price predictions. These are not guarantees. Crypto markets are volatile. Always DYOR. Not financial advice.
Also Read: Optimism (OP) Descending Channel Retest Could Trigger Major Rally to $1.34
Be the first to comment