

What to know:
- PEPE is consolidating in a falling wedge, signaling a potential breakout toward $0.00002 if resistance is broken.
- Indicators remain supportive, with RSI at 64.02 and MACD showing bullish alignment above zero, confirming momentum.
- Analysts suggest fading selling pressure and rising buyer interest could trigger an upward move in the near term.

Pepe (PEPE) is moving in a neutral price setup with a breakout in sight as the token approaches the upper boundary of the falling wedge pattern. However, the derivative data point to declining momentum with the decreasing open interest and volume in the derivative market.
According to CoinMarketCap, as of Thursday, May 7, the PEPE price is currently standing at $0.000004123, with signs of stabilization over the last week.

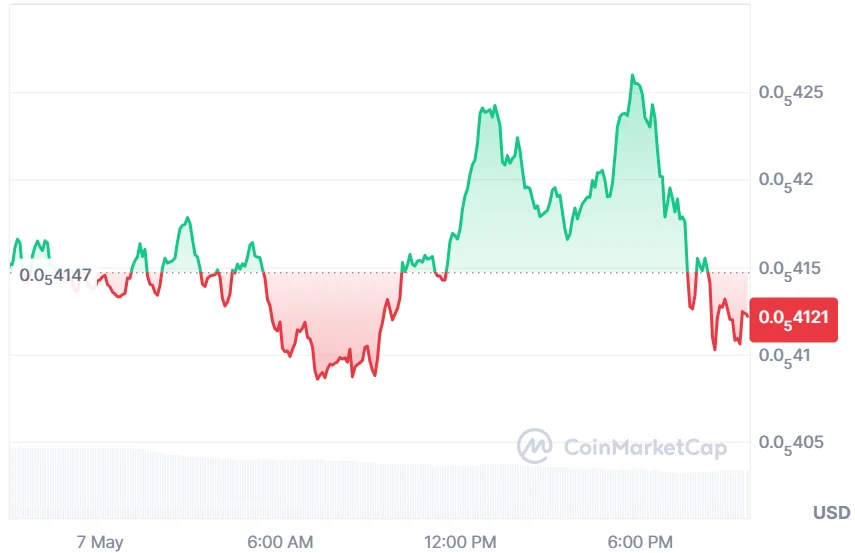
Source: CoinMarketCap

PEPE Price Eyes $0.00002 After Bullish Pattern Formation
Furthermore, the crypto analyst Butterfly pointed out that the PEPE price is showing strong bullish signals as it approaches a potential breakout from a falling wedge pattern on the 3-day timeframe.
The structure suggests selling pressure is fading, while accumulation continues to strengthen behind the scenes. Traders are now watching closely for confirmation of a momentum shift that could ignite renewed interest across the meme coin market.
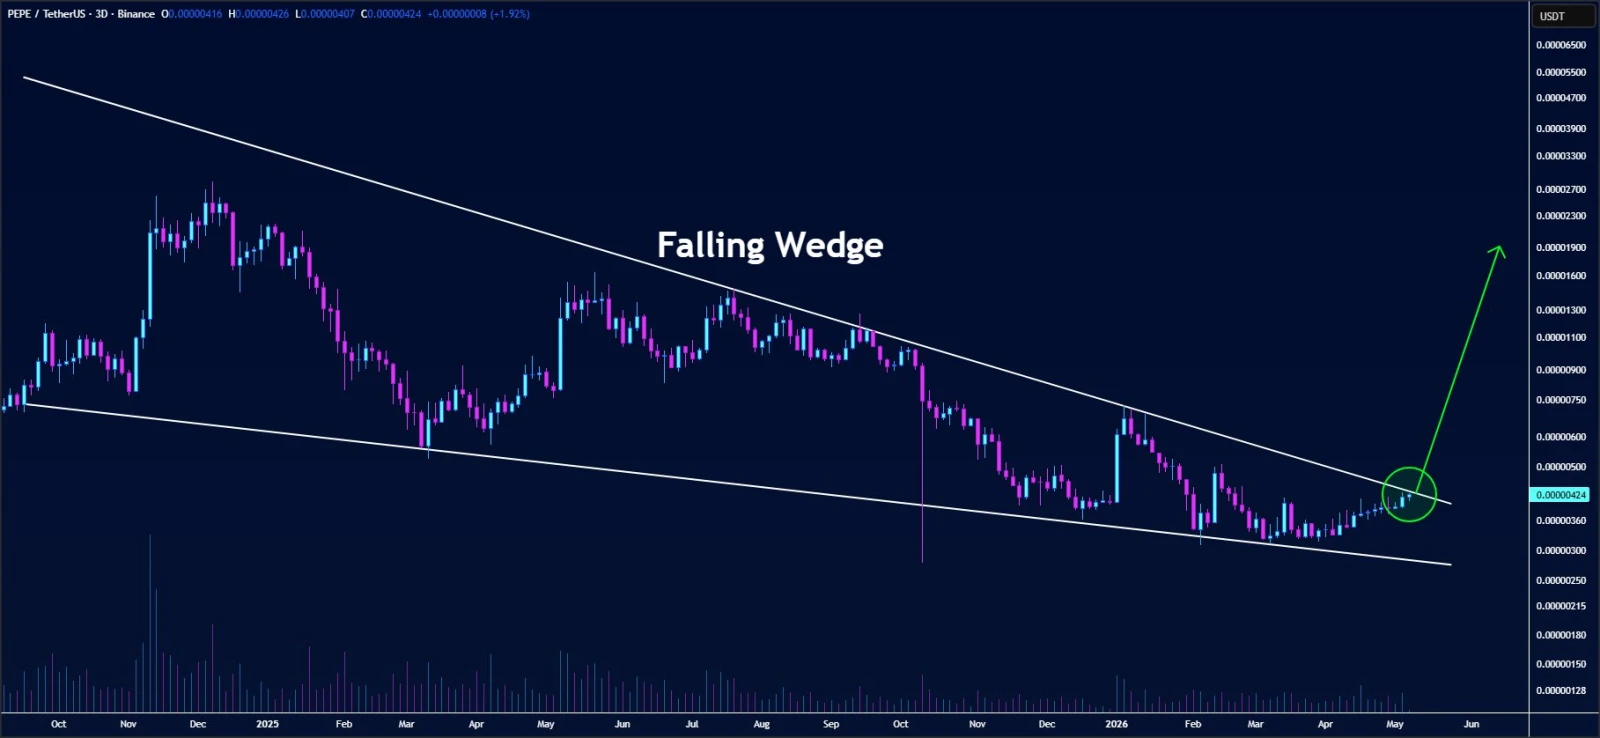
Source: Butterfly’s X Post
If buyers successfully push above key resistance levels, analysts believe the PEPE price could rally aggressively toward the $0.00002 target. Rising market optimism and increasing trading activity are adding momentum to the bullish outlook.
With meme coins regaining attention across crypto markets, the PEPE price may be preparing for a significant breakout move in the near term.
Also Read: Pepe coin (PEPE) Nears Breakout Zone With 85% Bullish Bias
Technical Indicators Reinforce Positive Momentum
According to TradingView, RSI stands at 64.02, pointing out a consistent bullish trend that is not overbought yet. The rise indicates strong buy interest and not a speculative one.
As long as the RSI line remains above the yellow line, there will be an indication to keep going up till the critical point of 70 is achieved.
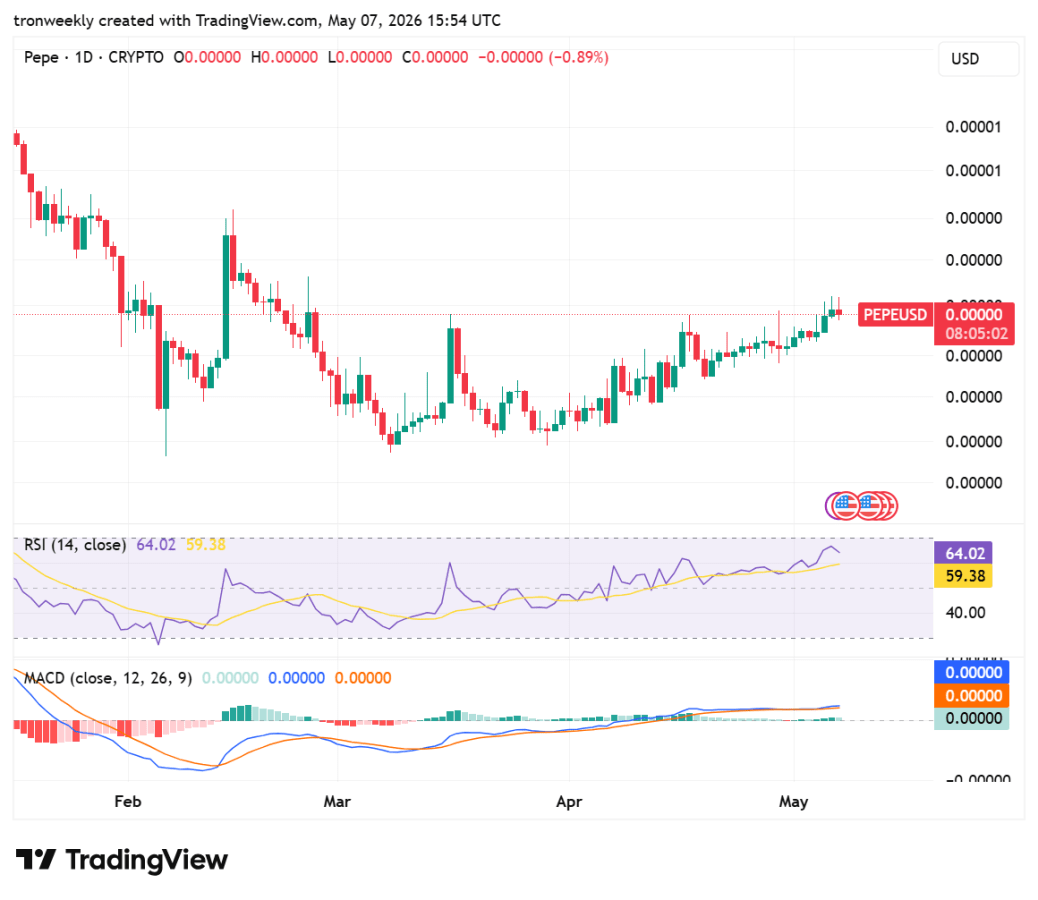
Source: TradingVIew
The MACD remains well into positive territory, with the blue line remaining above the orange signal line. The MACD being in positive alignment is an indication that a recovery trend has been sustained in the long run.
Even though there has been some flattening of the green histogram bars, this indicates that accumulation has continued steadily.
PEPE Derivative Data Point to Cautious Sentiment
According to Coinglass, the PEPE open interest fell by 5.01%, dropping to $211.57 million. This indicates that there are fewer derivative contracts in the market. The fall in open interest might be an indication that traders are reducing their positions.

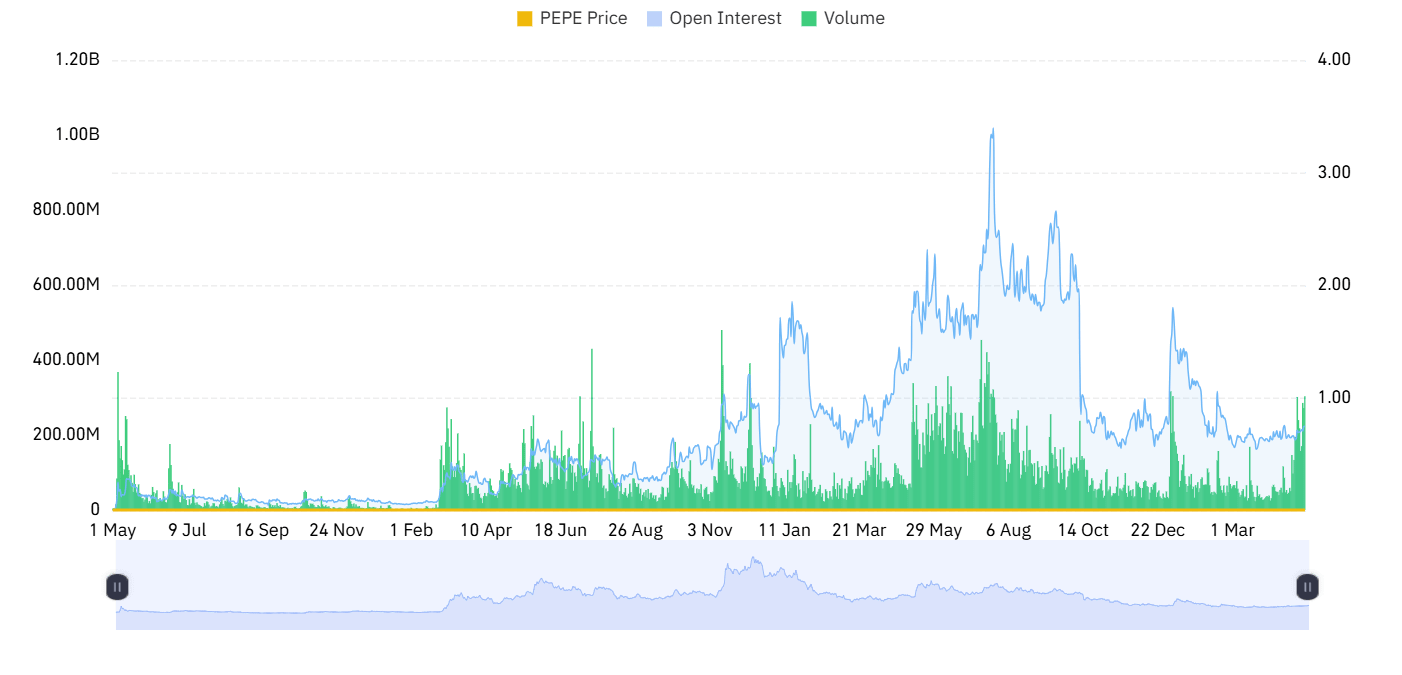
Source: Coinglass
However, the trading volume declined by 11.66% to $3.10 billion. This decrease is indicative of low trading activities, implying low liquidity compared to past levels and indicating that investors have taken a conservative approach to trading.
This article contains market analysis and price predictions. These are not guarantees. Crypto markets are volatile. Always DYOR. Not financial advice.
Also Read: PEPE Price Analysis: Bullish Wedge Pattern Hints at Recovery Toward $0.000016
Be the first to comment