


What to know:
- Bitcoin trades near $65,000 as Brandt’s bearish chart points toward the $58,000 level.
- U.S. spot Bitcoin ETFs draw $865.3 million in net inflows over five straight sessions.
- One whale sells 7,513 BTC worth $486.9 million over three weeks, Lookonchain reports.

Peter Brandt leaned bearish on Bitcoin on Aug. 10, citing a large head-and-shoulders pattern. Bitcoin price remained near $65,000, while strong U.S. spot ETF inflows offered support and resistance near $67,260 continued to limit the recovery.
In an X post, Brandt said he had not opened a position. However, he said, “ I am not in the bet yet, but if I were to bet it would be for a decline.”
Why Bitcoin Price Remains Below $67,260 Resistance
The cautious stance took place after the breakdown of Bitcoin price from the large head-and-shoulders formation in the summer. Institutional interest was flowing in the opposite direction, with U.S. spot Bitcoin ETFs receiving $865.3 million in five days.

Also Read: Ethereum Price Eyes $2,100 as Monthly TD Signals Turn Bullish
BTC is trading at around $65,021 on the daily time frame. The asset was sitting above its 54-day simple moving average at $64,352 but trading below its resistance line at $67,260.
The moving average displayed its stability despite the June sell-off. Yet, Bitcoin price could not break the level necessary for weakening the bearish formation of Brandt.
The average true range is located at 1,672, which means that daily trading ranges remain large. The Average Directional Index was at 11.16.
The low ADX reading is the indicator of weak trend power. This reading reflects the situation of Bitcoin price trading sideways following the prior decline into the $58,000 to $60,000 range.
According to the chart of Brandt, the head-and-shoulders formation was forming during April-June. The neckline was already broken down at $75,000, and the line drawn on the chart pointed towards $58,000.
The target is Brandt’s technical picture, not the confirmed price target. A break above $67,260 will reduce the bearish formation on the chart.
Bitcoin Faces Whale Sales Despite ETF Inflows
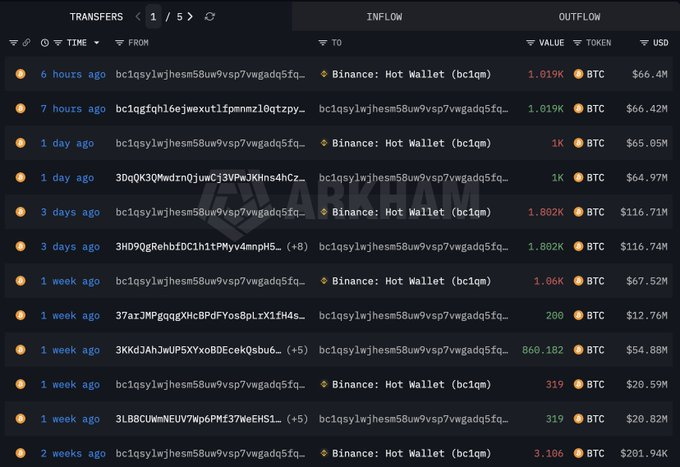
Lookonchain reported that one whale sold another 1,019 BTC worth about $66.4 million. The same wallet had sold 7,513 BTC valued near $486.9 million over three weeks.
The transactions show selling by one tracked holder. They do not establish that large Bitcoin investors are selling as a group.
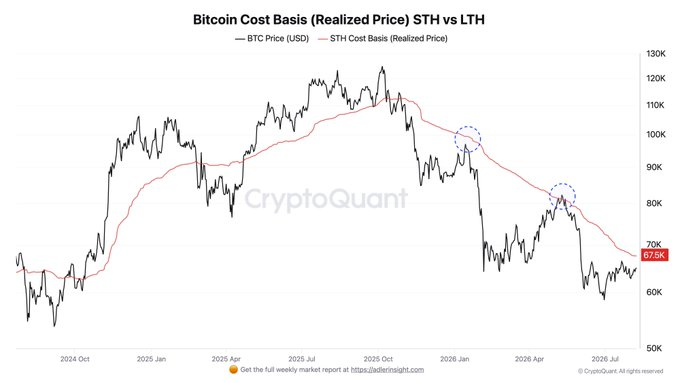
The Bitcoin price also remained below the realized price of short-term holders. CryptoQuant analyst Axel Adler Jr. placed that cost basis at $67,523 on Aug. 8.
The level represents the average purchase price of coins held for fewer than 155 days. It sits close to Brandt’s resistance area and marks a breakeven point for that cohort.
From Aug. 3 to Aug. 7, Farside Investors saw five straight days of inflows, totaling $170.1 million, $211.5 million, $244.4 million, $137.6 million, and $101.7 million, respectively. Farside reported that all sessions saw positive flows.
The total inflows amount to $865.3 million. The flows gave bulls a counterweight to bearish chart patterns and whale sales being tracked.
The upcoming major economic event is the release of the July U.S. Consumer Price Index. The report will be released on Aug. 12 at 8:30 a.m. ET.
In the previous report, nonfarm payrolls dropped by 23,000 in July. May and June numbers have been revised lower by 103,000 total.
Immediate support for BTC price is found near its 54-day moving average, and immediate resistance is seen between $67,260 and $67,523. Inability to clear this zone would mean that Brandt’s $58,000 scenario is still possible.
Also Read: Bitcoin Price Break Above $65,800 Opens Path Toward $82,900
This article contains market analysis and price predictions. These are not guarantees. Crypto markets are volatile. Always DYOR. Not financial advice.



Be the first to comment