



Peter Brandt says XRP’s charts alone provide reason to consider a trade, as a potential inverse head-and-shoulders pattern forms near the $1.50-$1.55 neckline.
Veteran trader Peter Brandt has again turned his attention to XRP, saying the crypto price charts alone are enough to justify considering a trade, despite his previous skepticism toward XRP’s fundamental valuation.
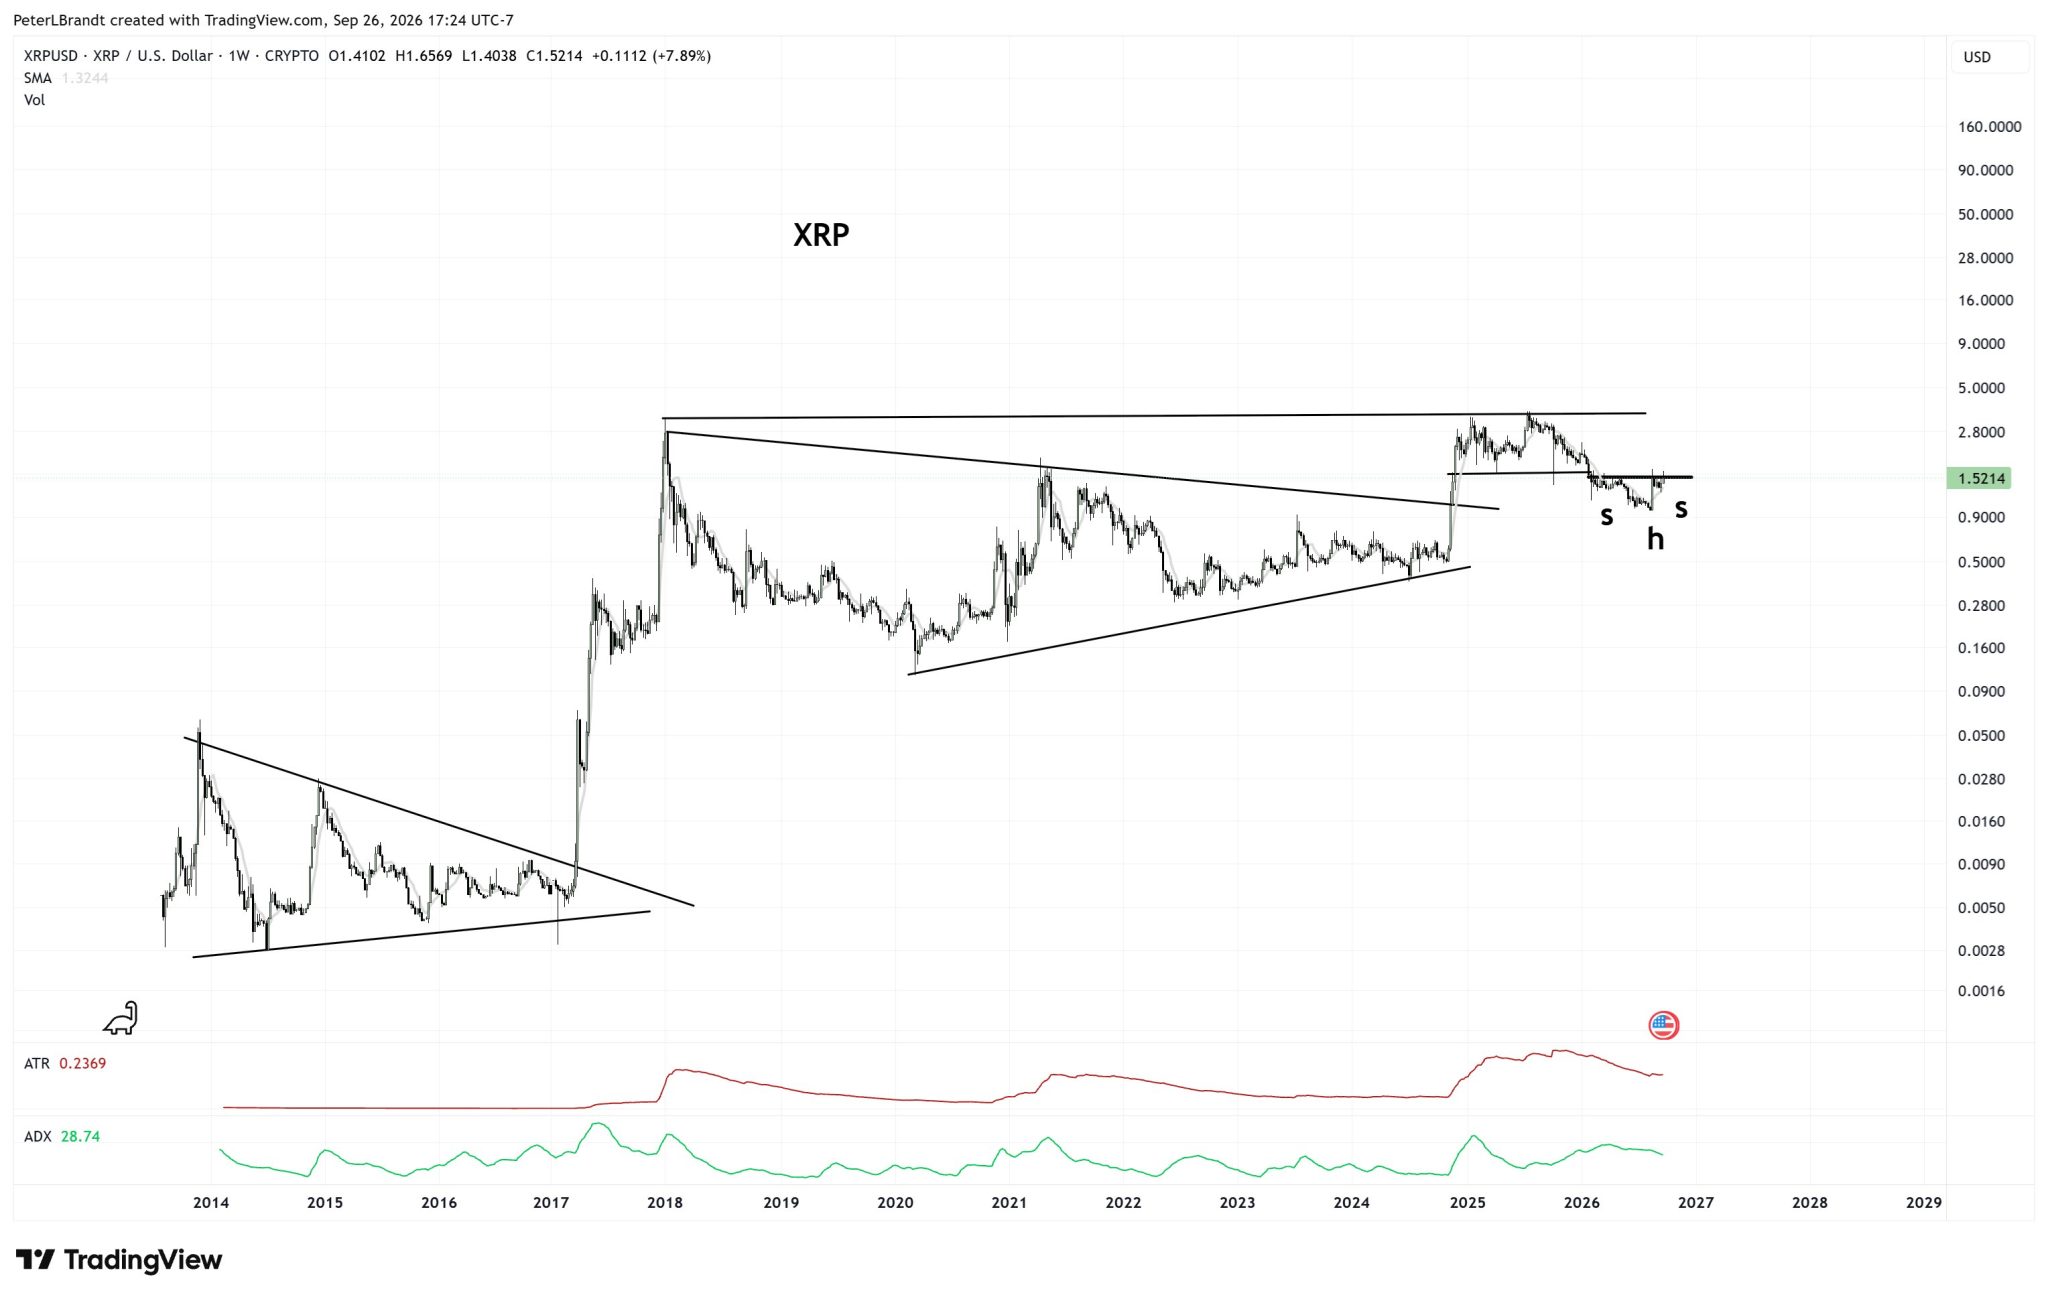
His latest weekly chart highlights a possible inverse head-and-shoulders structure near $1.52 while also placing the current setup within more than a decade of XRP price history.
Brandt said investors do not need to become what he called a “certified cult member” to be interested in XRP, adding that “the charts alone have always been enough reason for us to make a bet.” He then distinguished between keeping an open mind and following an asset without sufficient judgment.

XRP Weekly Chart Shows Potential Inverse Head-and-Shoulders
Brandt’s chart places XRP at approximately $1.5214, after a weekly candle that opened at $1.4102, reached $1.6569, and gained 7.89%. The token is also trading above the chart’s weekly simple moving average near $1.3244.
The most immediate structure appears on the right side of the chart, where Brandt labels three recent lows “s,” “h,” and “s”—shoulder, head, and shoulder.
This resembles an inverse head-and-shoulders formation, with a horizontal neckline sitting around the $1.50-$1.55 region. XRP is currently testing this neckline rather than trading decisively above it.
Under classical chart analysis, the pattern would require a sustained break above the neckline before being considered confirmed. XRP has already traded as high as $1.6569 during the latest weekly candle, but the chart’s closing reference remains near $1.52.
Using the approximate distance between the head around the $0.95-$1 region and the neckline near $1.52 produces a conventional measured-move area around $2.05-$2.10 if the structure confirms. This is a technical calculation from the pattern, not a target stated on Brandt’s chart.
Brandt’s Chart Also Tracks Two Major XRP Breakouts
The chart does not focus only on the latest formation.
On the far left, XRP’s price action between roughly 2014 and 2017 shows a tightening structure formed by descending resistance and rising support. XRP eventually broke out of that formation during the 2017 market expansion.
A much larger structure followed after XRP’s 2018 peak.
Brandt draws a descending upper trendline extending from the 2018 high and a rising lower trendline beginning around the 2020 period. These boundaries converged for several years before XRP eventually broke above the descending resistance during its late-2024 rally. HTLtCe6WcAE2mZY
After that breakout, XRP advanced into a broad range whose upper boundary sits around the $3.30-$3.40 area. The token has since retraced toward the lower part of this post-breakout range, creating the smaller shoulder-head-shoulder structure now highlighted on the chart.
This makes the $1.50-$1.55 zone important twice: it is both the immediate neckline of the possible inverse head-and-shoulders pattern and a horizontal level XRP is attempting to reclaim after its 2026 decline.
ADX Shows XRP Remains in a Meaningful Trend
Brandt’s chart also displays an ADX reading of 28.74.
ADX measures the strength of a trend rather than whether that trend is bullish or bearish. Readings above 25 are commonly associated with a market showing meaningful directional strength.
The chart’s ATR stands at 0.2369, representing roughly 15.6% of XRP’s $1.5214 reference price. This indicates that weekly price ranges remain relatively wide. HTLtCe6WcAE2mZY
Brandt Previously Questioned XRP’s Fundamental Valuation
Brandt’s latest chart-based interest comes after much more skeptical remarks about XRP’s fundamentals.
During a recent Cointelegraph interview, Brandt acknowledged that XRP “can be effectively used for transactional purposes cheaply.” However, he argued that transactional utility alone does not automatically mean an asset should become more valuable. Pasted text
He separated XRP’s transactional role from Bitcoin’s store-of-value thesis and Ethereum’s ability to support applications and other functionality. Pasted text
His latest comments therefore draw a distinction between fundamental conviction and technical trading. Brandt is not presenting the chart as proof of XRP’s underlying valuation; rather, he is saying that its price structure alone can provide a reason to consider a trade.
Brandt has also previously mapped an eventual XRP advance toward $5.40, although that separate projection did not include a specific deadline and did not confirm that he had opened a position. TokenPost
For the current weekly setup, the first technical hurdle remains the $1.50-$1.55 neckline area. A sustained move above it would confirm more of the inverse head-and-shoulders structure, while failure to hold the area would leave XRP inside its broader consolidation.



Be the first to comment