


What to know:
- Polkadot (DOT) price dropped to a key descending trendline support near $1.02 after losing the $1.20–$1.25 demand zone.
- Technical indicators remain bearish, with MACD showing accelerating downside momentum.
- DOT Negative funding rates and weak market sentiment suggest traders remain cautious despite oversold conditions.

Polkadot (DOT) is under heavy selling after it dropped below a major demand zone. Traders are watching to see if the current support prevents another big drop. Even with the weak overall market, analysts believe that what happens next could determine DOT’s short-term direction.
Currently, Polkadot price is at $1.02. Its 24-hour trading volume is $230.01 million, and its market cap is $1.71 billion. DOT has fallen 5.51% in the last 24 hours, with pessimism still strongly affecting the altcoin market.

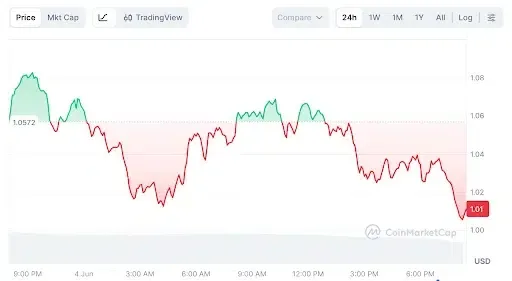
Source: CoinMarketcap

Polkadot Price Tests Critical Descending Trendline Support
Crypto analyst Binance Killers says Polkadot (DOT) hit a major downward trendline support around $1.02. The currency lost the key $1.20–$1.25 demand zone.
If DOT can hold onto that support, there might be a short-term boost towards $1.10–$1.14. However, should prices fall from here, things could get worse fast.
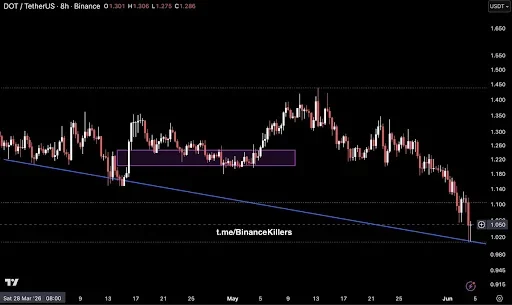

Source: Analyst Binance Killers X Post
Right now, the fight at this support level is crucial; it’s essentially a last line of defense for buyers before more significant losses occur.
Also Read: SUI Analyst Reviews $0.60–$0.90 Zone After 1,300% Rally
Bears Remain in Control Below Key Support
According to DOT data on TradingView, the daily chart remains clearly bearish. Recently, Polkadot dipped below the key $1.10 level, resting at around $1.04, close to the lower Bollinger Band.
Currently, Polkadot price is well below the 20-day Bollinger midline at $1.20, indicating that sellers are still in control. With the increasing gap between the current price and the upper Bollinger Band at $1.36, it looks like volatility is rising along with downside pressure.
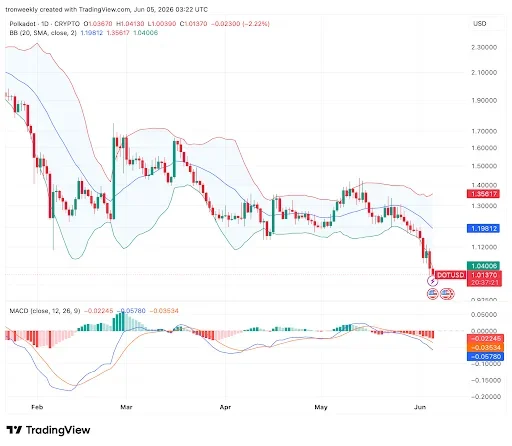

Source: Tradingview
The MACD indicates weakness with its line dipping below the signal line and red bars increasing, showing growing bearish momentum.
While Polkadot price is nearing oversold levels and might bounce slightly, the general trend remains downward. Buyers would need to push prices above $1.12–$1.20 for any change. If that support sticks, prices could stay higher, but if it fails, expect them to fall more.
DOT Derivatives Data Signals Cautious Market Sentiment
Polkadot’s derivatives market shows traders moving cautiously. The open interest-weighted funding rate is -0.0025%, with DOT priced at about $1.04. This slight negative rate signals stronger bearish feelings than bullish ones, yet traders aren’t going wild with short selling either.
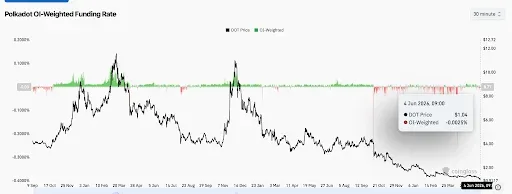

Source: CoinGlass
This highlights a pressured market following DOT’s lengthy decline. Investors are hesitant to move in a new direction until they see solid evidence.
With the broader crypto market remaining weak, altcoins get dragged down too. Now, everyone watches to see if Polkadot will maintain its crucial support between $1.00 and $1.02. If it does, there might be a relief rally. If not, more dropping could occur.
This article contains market analysis and price predictions. These are not guarantees. Crypto markets are volatile. Always DYOR. Not financial advice.
Also Read: SUI Price Prediction: Will Strong Support Trigger a Rally Toward $5.36?

Be the first to comment