


What to know:
- Quant (QNT) shows bullish momentum after breaking key moving averages, with RSI signaling strong buying.
- QNT price trades around $79.56, consolidating after a surge testing resistance near the 200 EMA at $84.00.
- Analysts see a potential breakout for Quant, with targets up to $360, implying major upside if resistance breaks.

Quant (QNT) shows bullish momentum after breaking above key moving averages, while the RSI signals continued buying strength for the QNT price. However, declining open interest and trading volume reflect cautious sentiment and weaker participation in the derivatives market despite improving price structure.
At the time of writing, QNT is trading at $79.56 with a 24-hour trading volume of $19.09 million and a market capitalization of $940.2 million. Despite the 7.21% decline over the last 24 hours, participants are waiting to see if the QNT price could pass the key resistance to trigger a reversal.

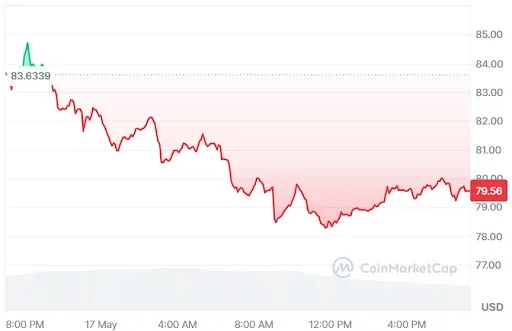
Source: CoinMarketCap

Quant Price Outlook Turns Bullish After Support Rebound
According to the crypto analyst Jonathan Carter, QNT appears to be gaining traction amid its resurgence from an important level of support, signaling the potential emergence of a new uptrend.
Technical analysts suggest that the asset is now on the verge of a vital breakout phase, supported by buyers’ unwavering resistance against lower highs. Increased optimism has led to hopes that QNT might soon begin an impressive rise.
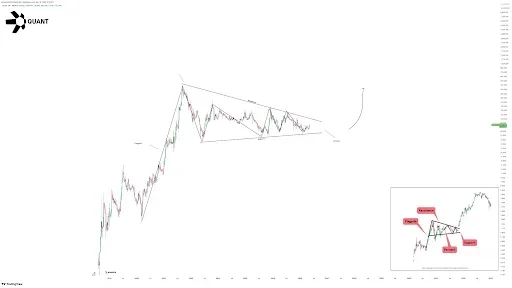

Source: Javon Marks’ X Post
Assuming that there is a breakout, the QNT price is seen to be moving towards the price level of $360, implying around 328% growth from its present price point.
This amounts to an almost 4.28x profit in terms of percentage. This will translate into gains of more than four times, which would make QNT one of the best altcoin performers.
Also Read: Quant (QNT) Stabilizes at $70 Before Possible $260 Expansion Wave
QNT Price Eyes Breakout Above Key Moving Averages
According to TradingView, the QNT price has finally broken higher following a long-term consolidation trend.
It surpassed its 20, 50, and 100 EMAs and peaked around the $84 mark before encountering rejection from the 200 EMA level. At present, the QNT price is retracing back down to $79.47, testing the strength of the new upturn.

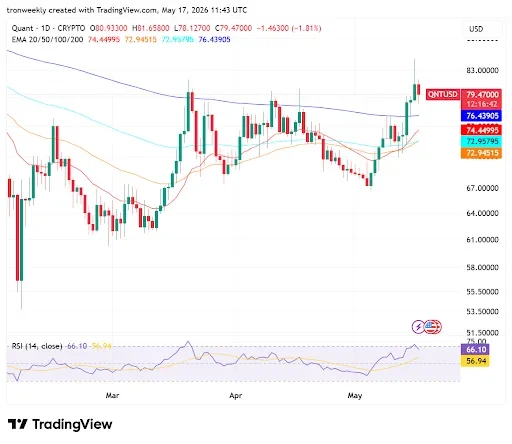
Source: TradingView
The RSI indicator supports this current rally, where the purple curve climbs way above the yellow signal line and touches 66.10.
On the verge of entering the overbought territory, it indicates that the strong buying trend has potential for further expansion. The current stabilization follows suit with the QNT price action, implying a possible consolidation phase before deciding on the future direction.
Derivative Data Points to a Cautious Outlook
Despite this constructive price structure, derivative data point to a cautious outlook. According to Coinglass, the QNT open interest has dropped by 4.10%, to reach $22.07 million. The decline implies that the current open interest is being reduced by market players, not increasing it, thus implying weak investor participation.

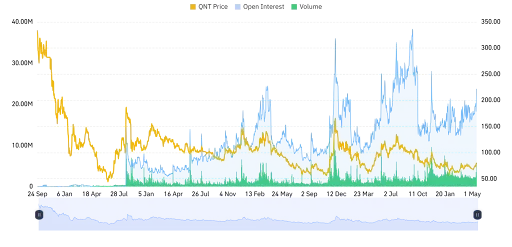
Source: Coinglass
The trading volume declined by 10.05% to $52.34 million. This decline reflects lower demand and supply in the market and suggests that there might be weaker momentum or lower liquidity in the market.
This article contains market analysis and price predictions. These are not guarantees. Crypto markets are volatile. Always DYOR. Not financial advice.
Also Read: QNT Price Shows 60% Upside Potential as Bulls Challenge Resistance Trendline

Be the first to comment