


What to know:
- QNT remains above key long-term support, signaling potential accumulation despite a weak altcoin market.
- Price stays below major EMAs, confirming a bearish structure with short-term resistance ahead.
- Holding long-term support may keep the bullish outlook intact, with potential $400–$670 targets.

Quant (QNT) has shown relative resilience by holding a key long-term support despite a weak broader altcoin cycle, though its overall structure remains bearish with strong overhead resistance for the QNT price. Momentum is neutral and consolidating, while rising derivative activity and stable volume reflect growing engagement.
At the time of writing, QNT is trading at $73.66 with a 24-hour trading volume of $8.92 million and a market capitalization of $889.31 million. Despite the signs of stability over the last 24 hours, QNT holds above the long-term support zone, which keeps the bullish reversal intact.
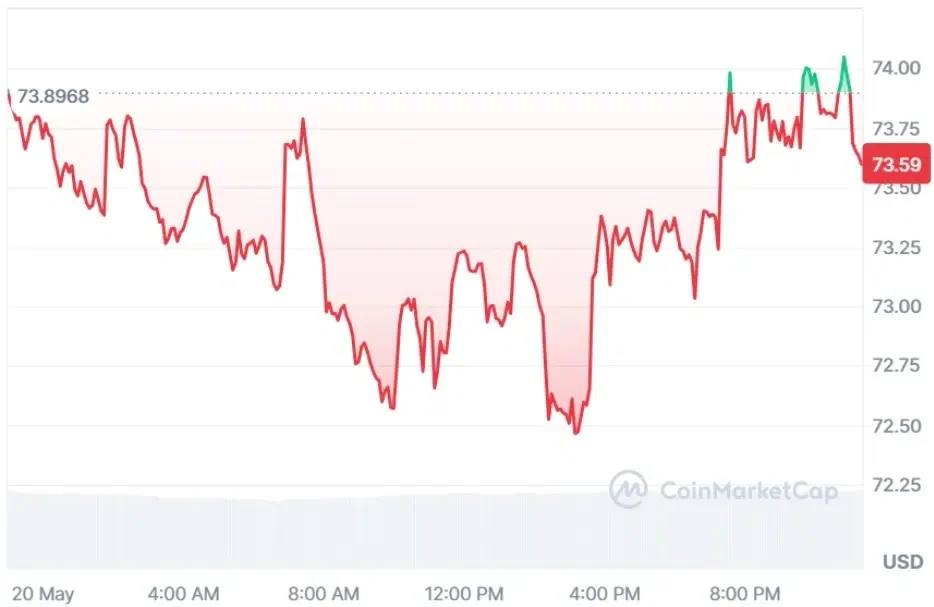

Source: CoinMarketCap

QNT Price Holds Key Support With $670 in Focus
Furthermore, the crypto analyst CryptoBullet highlighted that the QNT price has shown unusual resilience in a weak altcoin cycle, holding its June 2022 low while many assets broke key supports.
This stability is viewed as a structural signal rather than short-term strength, suggesting possible long-term accumulation. Traders see this level as critical in defining whether the asset maintains a broader bullish framework.
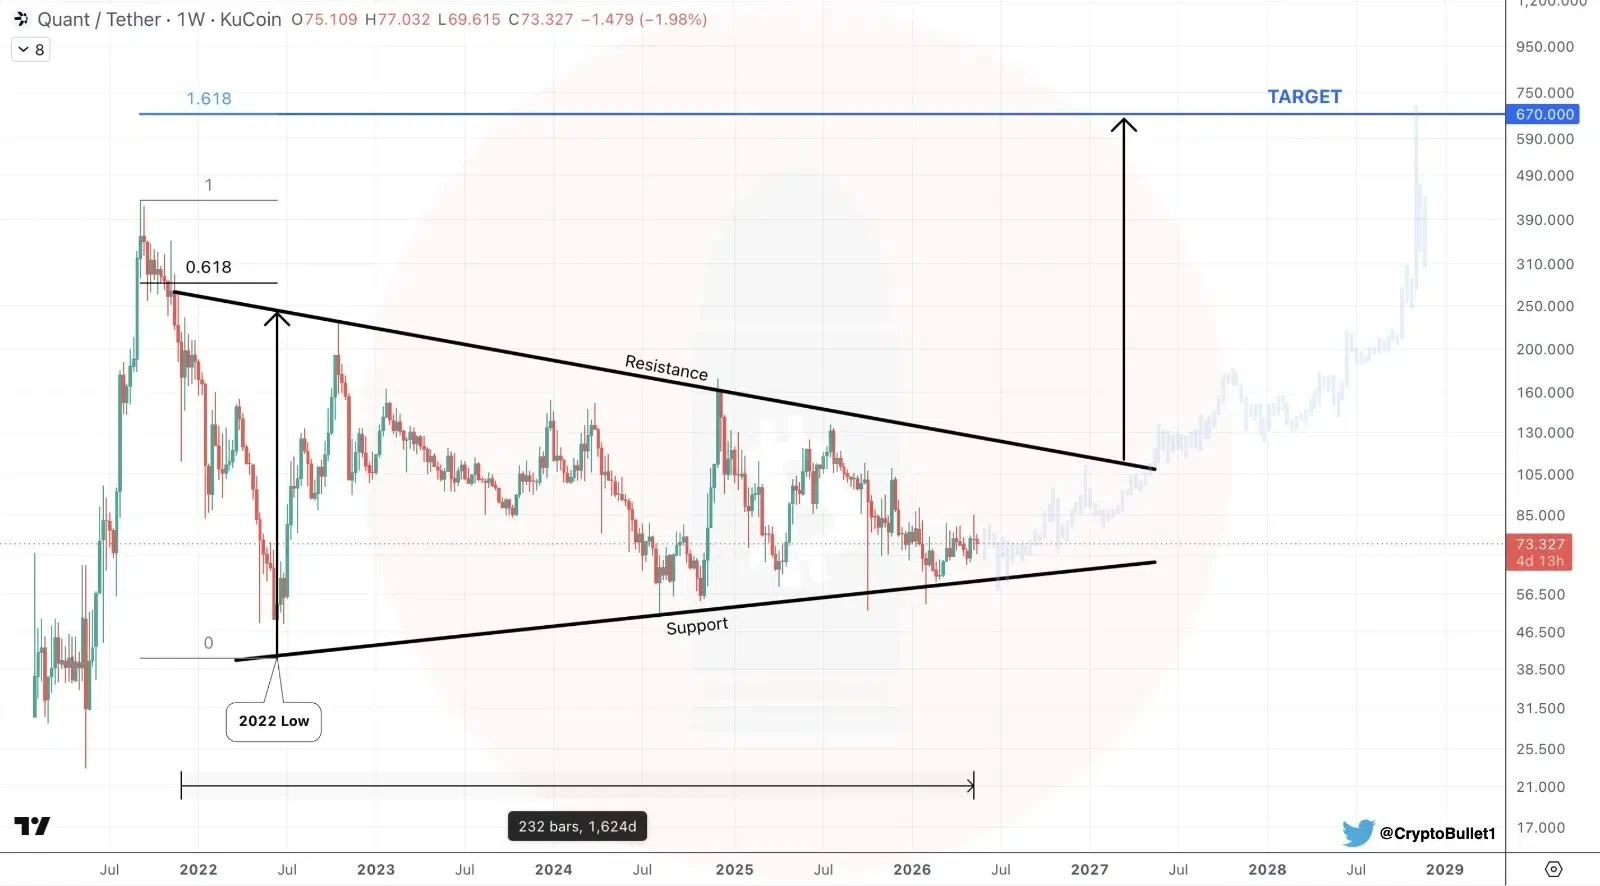

Source: CryptoBullet’s X Post
With the QNT price remaining above the lows seen in 2022 all the way until November 2026, the outlook appears to be more positive in the extended time frame of 2027-2029.
With this scenario playing out, projections point towards the emergence of a possible all-time high ranging from $400 to $670, owing to improved liquidity and growth in the market.
Also Read: QNT Price Shows 60% Upside Potential as Bulls Challenge Resistance Trendline
Technical Indicators Point to Consolidation Phase
According to TradingView, the QNT price exhibits a bearish trend, which is characterized by a series of lower lows and lower highs.
The QNT price trades below all three exponential moving averages (EMAs) at 50, 100, and 200 periods. However, a short-term consolidation pattern seems to be forming at around $60.50 in a bid to move back above the 20 EMA of $73.58.

Source: TradingView
With regard to the above-mentioned price action, the 14-period RSI indicator is seen sitting near the balanced level of 48.63.
The current position shows that the previous downtrend has now cooled down to become a sideways trend. Momentum is balanced, meaning that the buyers and sellers are both equally powerful.
QNT Derivative Data Point to Improving Outlook
However, QNT’s open interest increased by 8.64% to reach $22.17 million. The higher open interest implies that traders are locking capital into the derivatives market, thus expressing their confidence. This could be a result of changes in the market sentiment coupled with increased position-taking.
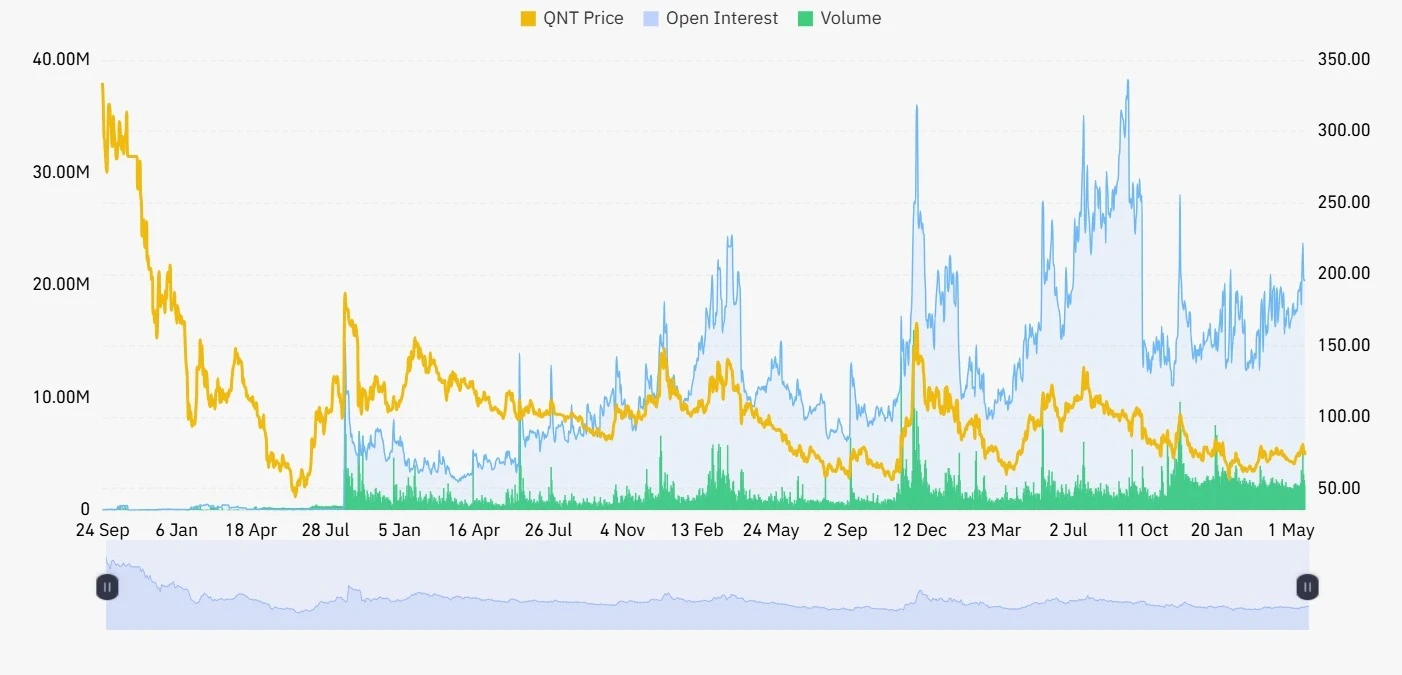

Source: Coinglass
The volume remained stable at $29.11 million, indicating sustained participation and liquidity in the market. Traders maintained their level of trading without any sudden changes, reflecting a stable attitude among traders.
This article contains market analysis and price predictions. These are not guarantees. Crypto markets are volatile. Always DYOR. Not financial advice.
Also Read: QNT Price Breakout Targets $360 Rally After Reclaiming Key Moving Averages

Be the first to comment