



Bitcoin pulled back below $65,000 on Thursday, July 23, hitting three-day lows near $64,799 after rallying as much as 16% from this month’s low and running into a resistance zone where several technical and macro factors now converge just days before the Federal Reserve’s July 28-29 meeting.
What Happened This Week for Bitcoin and the Broader Market
Bitcoin registered an intraday low near $57,735 earlier this month before reversing into a four-week rally that extended more than 15.9% off the yearly low, with weekly RSI divergence suggesting bearish momentum has been fading.
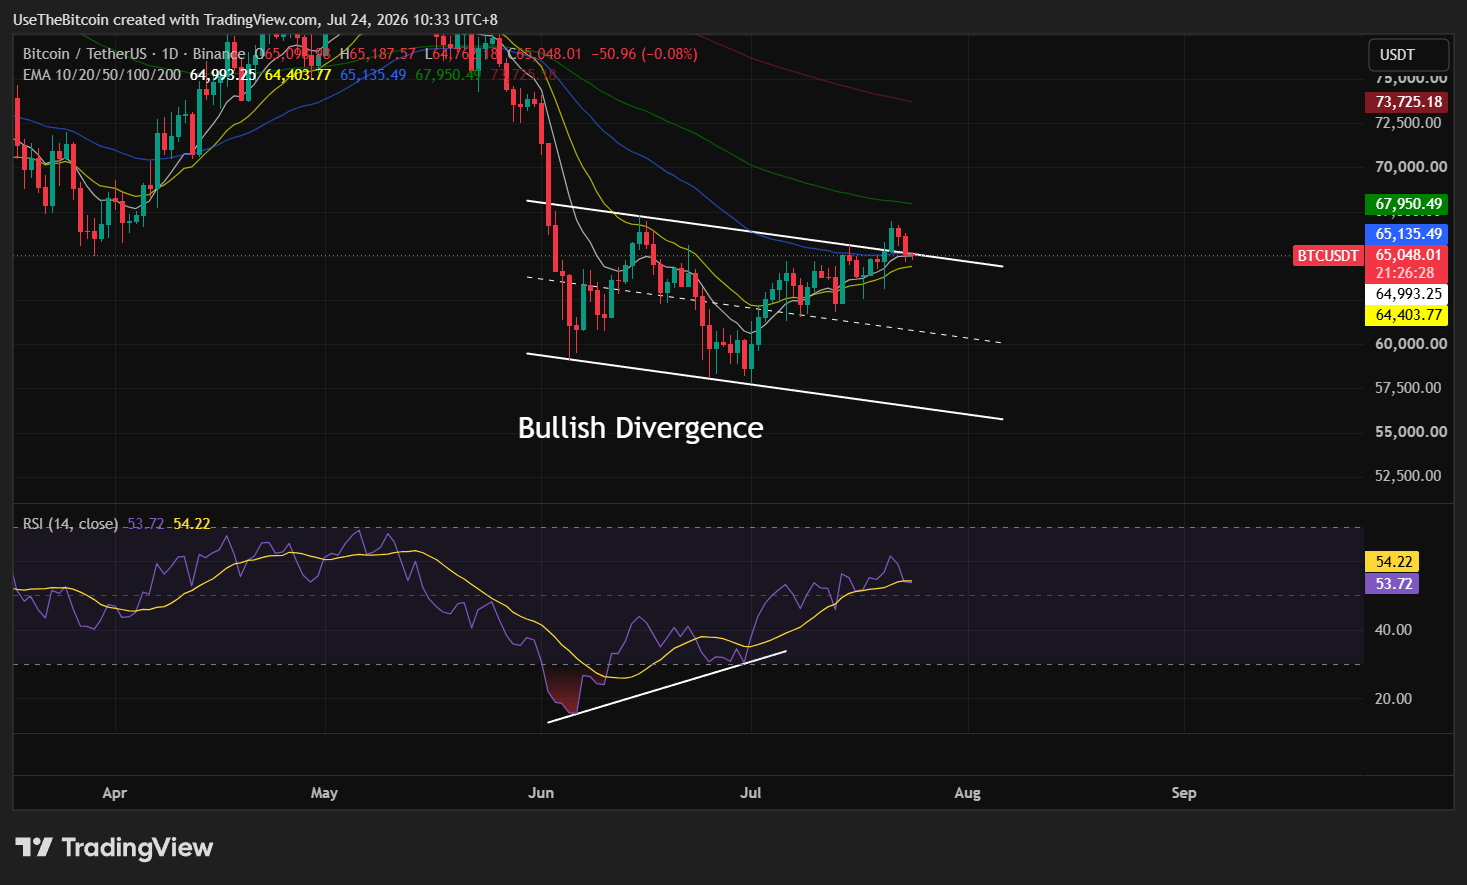
That recovery carried Bitcoin into the $65.5K-$66.7K supply zone after it reclaimed a descending trendline that had capped price for weeks, a genuine improvement in market structure even though the broader trend remains capped by a declining 100-day moving average.
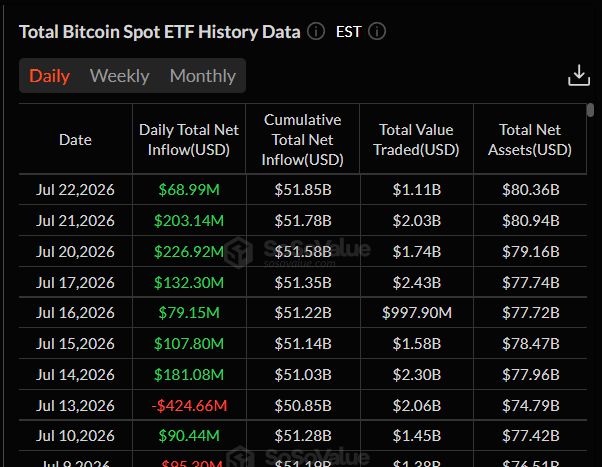
Earlier in the week, spot Bitcoin ETFs also logged seven straight days of inflows totaling $981.2 million since July 14 according to SoSoValue data, their longest positive streak in nine months, with BTC briefly touching $66,300 during that stretch.

However, that momentum reversed Thursday. US President Donald Trump warned on Truth Social that he would blame Iran for recent Houthi strikes on Saudi commercial vessels, and risk assets sold off broadly, bringing the S&P 500 down 1.2%, the Nasdaq dropped 2.2%, and Brent crude topped $100 a barrel for the first time since early June.

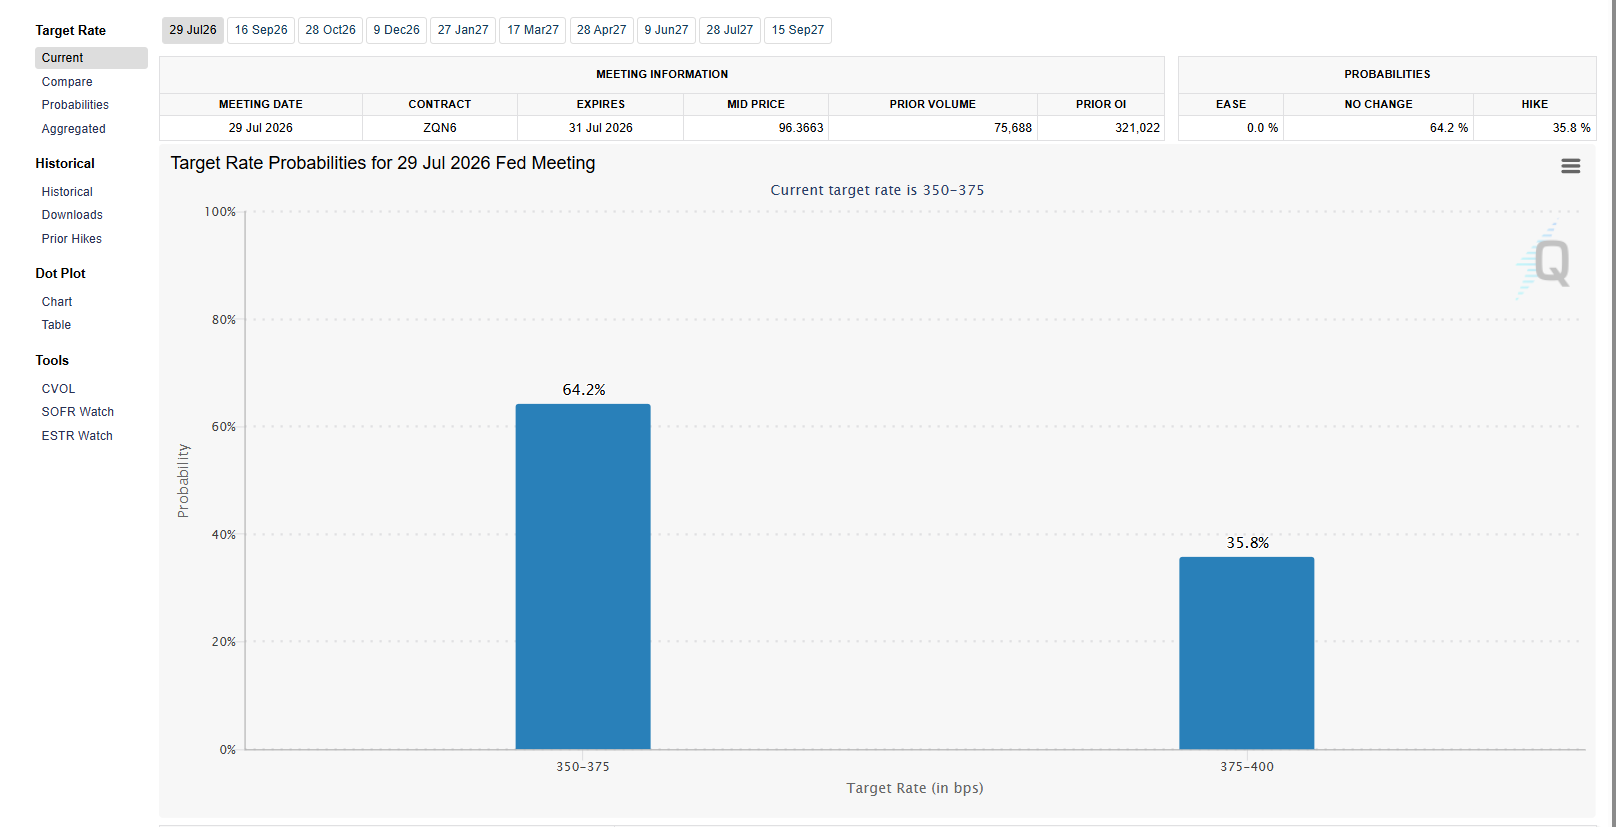
Moreover, Fed rate-hike odds for the July meeting jumped to nearly 40% on CME’s FedWatch Tool, up from about 12% a week earlier, while trading resource The Kobeissi Letter flagged 18-month highs in the 10-year Treasury yield as a sign of fresh economic strain.
Bitcoin Technical Analysis
Bitcoin briefly broke above the descending parallel channel on July 21, Tuesday, but the move quickly lost strength, and the price has now pulled back toward the upper trendline, making this area the key level to watch in the short term.
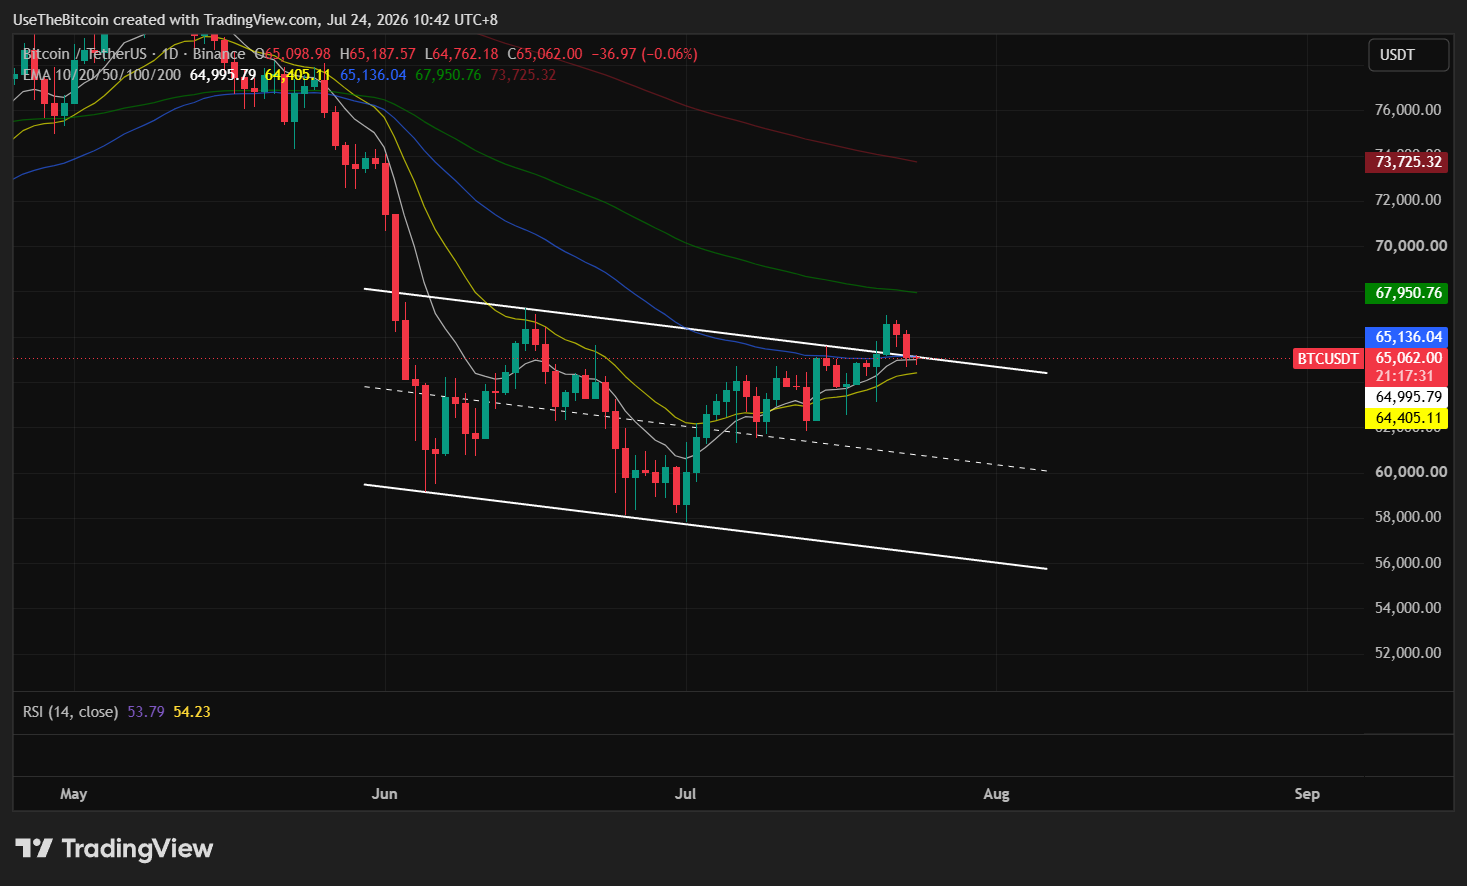
For the bullish case to remain intact, Bitcoin needs to retest the upper boundary of the channel and hold it as support, because a clean bounce from this level would suggest the breakout is still valid and could give buyers enough confidence to push the price higher again.
On the other hand, if Bitcoin slips back inside the parallel channel, it would weaken the breakout setup and raise the risk that the recent move was a false breakout, which could bring the lower support areas inside the channel back into focus.
What Analysts Are Saying For Bitcoin
Individual traders are split on what comes next. Exitpump argued the relief rally is likely ending, telling followers to “close your longs, go short once price breaks below 65K”.
Jelle took the opposite view, saying price was “still making progress” and that clearing the local area would open a “void towards $70k”.
Michaël van de Poppe called the 21-day moving average near $64,073 the level to watch, saying Bitcoin should see higher valuations near-term as long as it holds above that average, while describing $68,000 as “the final hurdle for a big breakout” and setting a $73,000 target if that resistance breaks.
Lastly, the 4-hour Elliott Wave analysis from Freedom_By_40 described a cautiously bullish structure contingent on Bitcoin holding $63,669, with upside extensions toward $69,687 to $73,240 if buyers regain control.
| Level | Role | Notes |
| $52,204 | Deep downside reference | 100% extension of the decline off the 2025 record high |
| $57,885–$58,725 | Key multi-month support | Defined by the 61.8% retracement of the 2022 advance and the August 2024 low-week close |
| $61,244 | Initial support | 61.8% retracement of the monthly range |
| $61,840–$63,111 | Major on-chain support zone | More than 1.3 million BTC previously changed hands here |
| $63,669 | Near-term key support | Sits near a key structural pivot on the shorter-term chart |
| $64,073 | 21-day moving average | Key level to hold |
| $64,900–$65,000 | Immediate resistance/decision zone | Where 10-period EMA and SMA cluster with sell signals |
| $65.5K–$66.7K | Supply zone | Prior distribution area; a decisive close above would expose $72K-$74K |
| $67,253–$67,322 | Weekly resistance confluence | 38.2% retracement of the May decline, median line convergence |
| $68,000 | “Final hurdle” resistance | Second test of this zone per van de Poppe, who set a $73,000 target on a break |
| $69,687–$73,240 | Elliott Wave upside targets | Conditional on reclaiming resistance with follow-through |
| $84,569 | No major supply wall until here | Around 582,000 BTC previously transacted at this level |
| $88,000 | Largest untouched short liquidity | Concentration on the one-year Binance liquidation heatmap |
The FOMC Catalyst
The Federal Reserve meets July 28 and 29 under Chair Kevin Warsh, with a policy statement expected at 2:00 p.m. Eastern on July 29 followed by a press conference.
Rate-hike odds for this meeting have risen sharply this week, a dynamic that has historically weighed on crypto markets when it moves in that direction.
Bottom Line
Bitcoin’s setup remains undecided. A decisive weekly close above $67,253 to $67,322 would strengthen the case for a larger trend reversal and reopen the path toward $72,000 to $74,000 and beyond. A sustained loss of $63,669, and especially the broader $61,840 to $63,111 on-chain support zone, would shift the emphasis back toward the corrective case and put the deeper $57,885 to $58,725 zone back in focus. With the FOMC decision landing days away and Iran-related macro risk still live, price action into the weekly close is likely to matter more than any single indicator on its own.
Disclosure: The writer holds Bitcoin.



Be the first to comment