


RaveDAO [RAVE] has slipped another 12% over the past day at press time. The broader outlook offers little to lean on, and with spot demand almost entirely absent, on the chart as much as in the order books, the price could swing lower still from its current level.
RAVE bulls retreat as conviction fades
Recent chart data points to weakening conviction among the investors who once read RAVE as bullish.
At the time of writing, the Bull Bear Power (BBP) indicator, which gauges whether bulls or bears hold sway over the market, showed that bulls were in control, though their grip has loosened considerably.
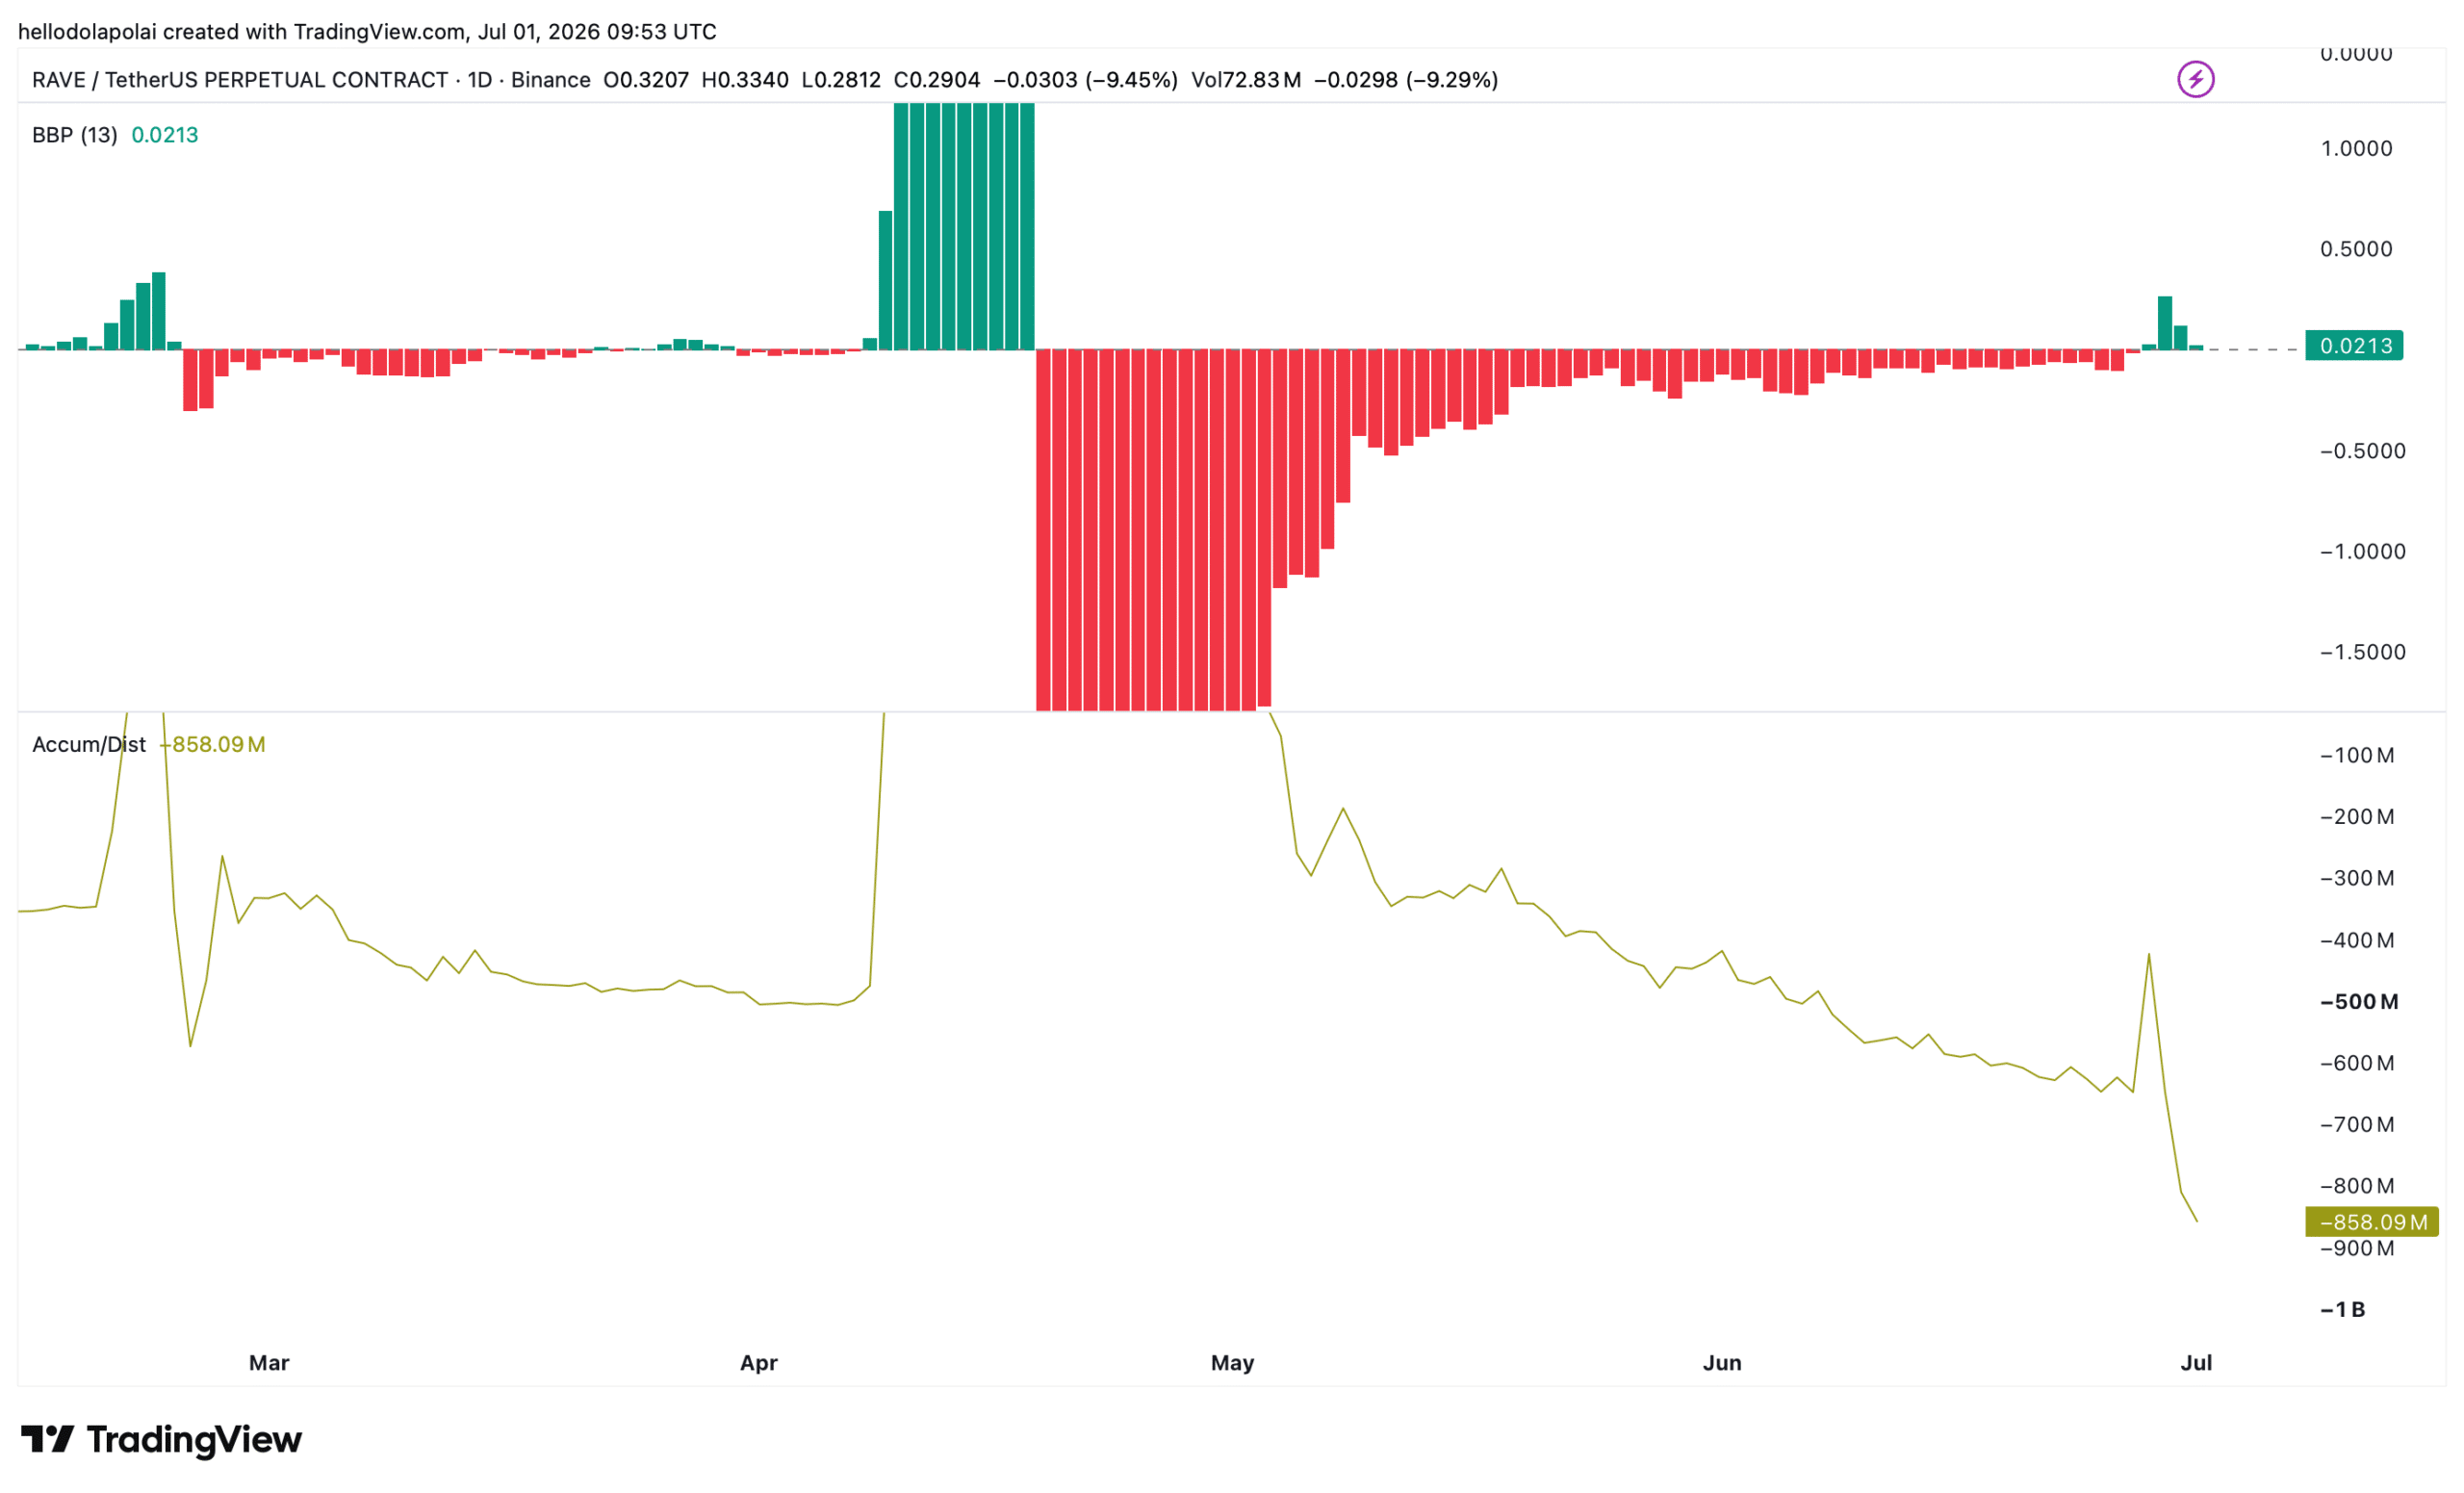
The histogram carries the same message, sliding from deep green to a lower green reading, a sign that bulls are gradually stepping back and unwinding their RAVE positions. RAVE’s Accumulation/Distribution (A/D) indicator provided the most accurate reading on the sell-off, with selling dominating trade over the last 24 hours as the A/D line fell.

Should BBP keep declining and possibly flip negative while A/D continues to plummet, the price would sit in an increasingly precarious position.
Whales drive the sell-off
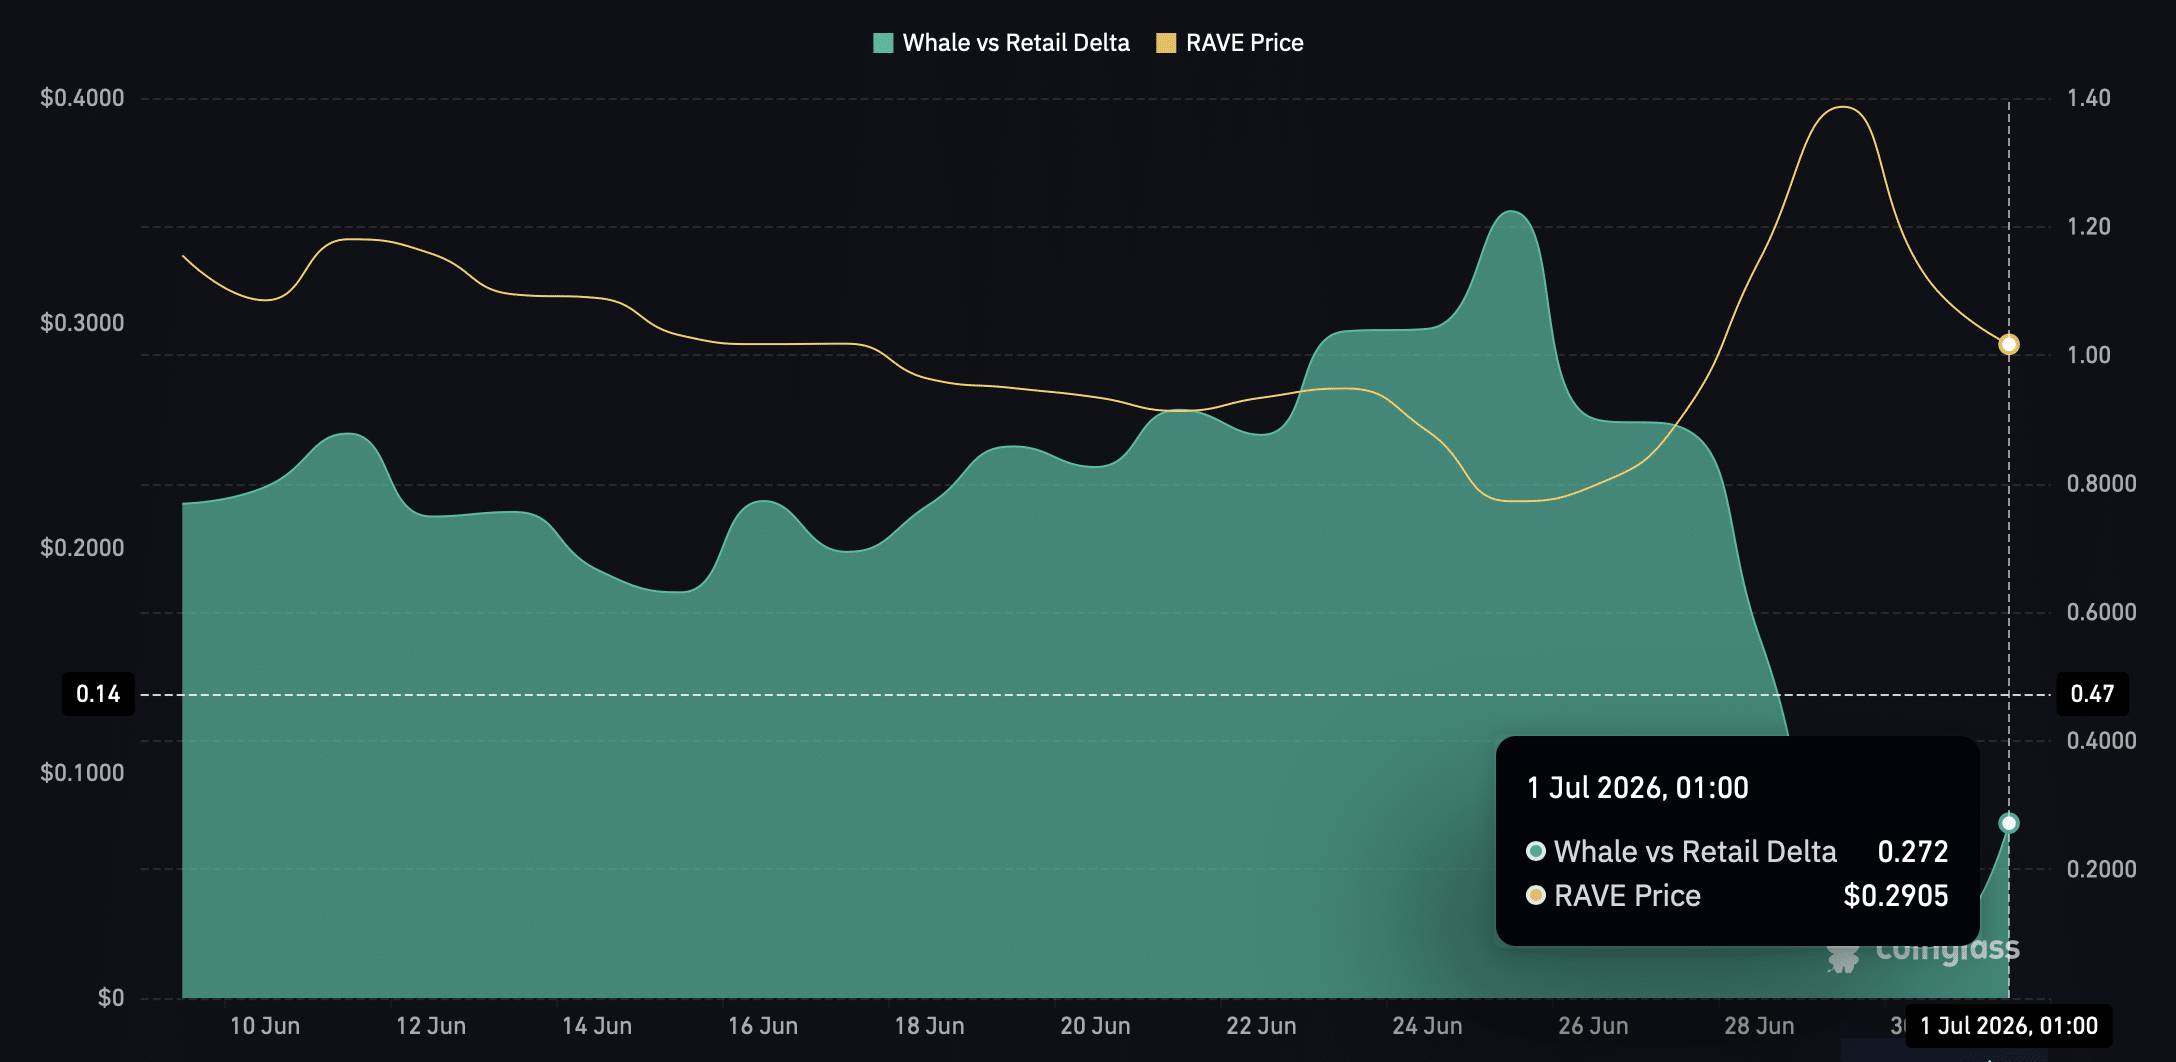
The sell-off carries added weight because the data pins whales as the driving force, and they look set to offload even more of the asset.
At the time of writing, the whale‑retail delta, a metric tracking which cohort is buying or selling, shows whales in the lead, with the reading climbing to 0.272.
In RAVE’s case, that influence is difficult to overlook, with CoinMarketCap data showing this cohort controls the majority of supply across the three chains where the token trades.
On BSC, the top ten wallets hold 93.03% of the supply, while the figures stand at 87.38% on Base and 97.42% on Ethereum. Concentration on this scale means whale activity during stretches like this often overshadows retail investor positioning.
RAVE spot demand weakens
RAVE’s spot demand has fallen over the past day, reversing the buying that had propped up the asset earlier in the week.
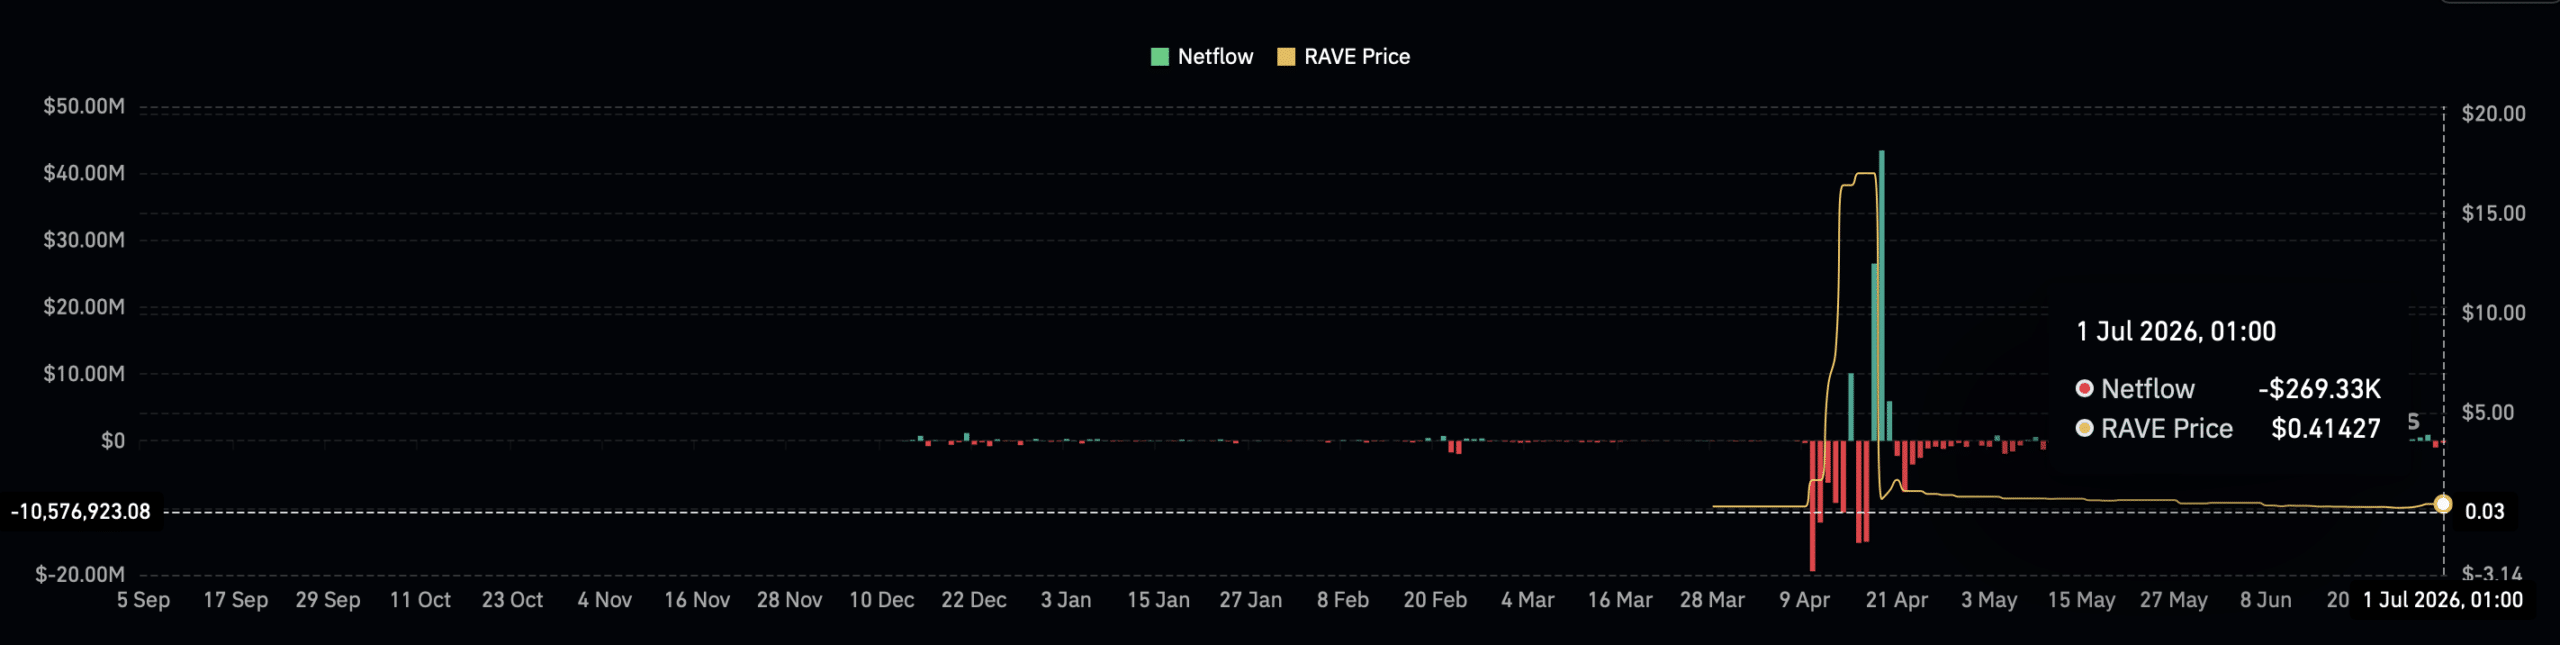
At press time, netflow has plunged to around ‑$269,000 over the past day. A decline of this kind does price no favors, particularly while broader market sentiment remains soft.
However, a further drop would reinforce the bearish outlook already sitting in the market and push RAVE lower on the chart.
Final Summary
- RAVE has shed another 12% over the past day as whale wallets drove an intensifying sell-off.
- Weakening spot demand and softening BBP and A/D readings left the price exposed to further downside if selling pressure holds.


Be the first to comment