



What to know:
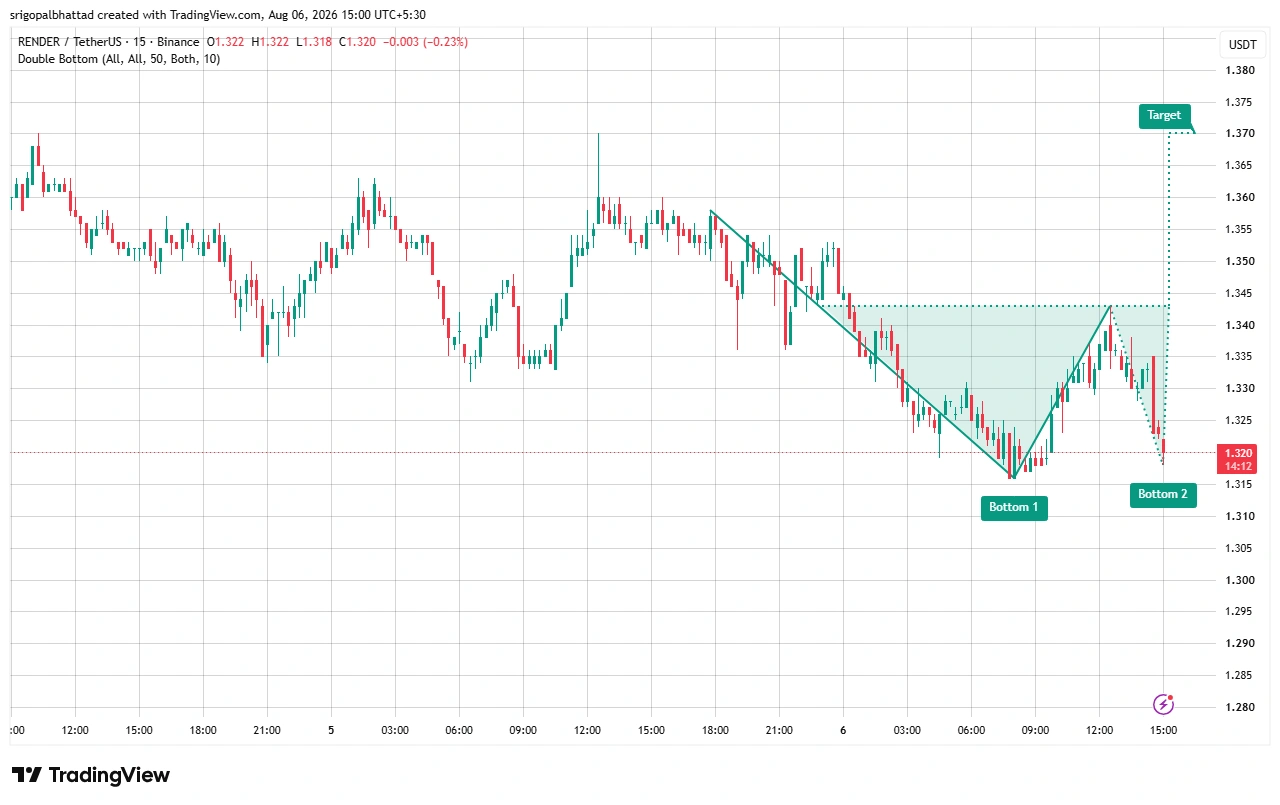
- RENDER price formed a bullish double-bottom near $1.315–$1.320, signaling growing buying interest.
- A breakout above $1.343–$1.345 could confirm the pattern and push the RENDER price toward $1.37.
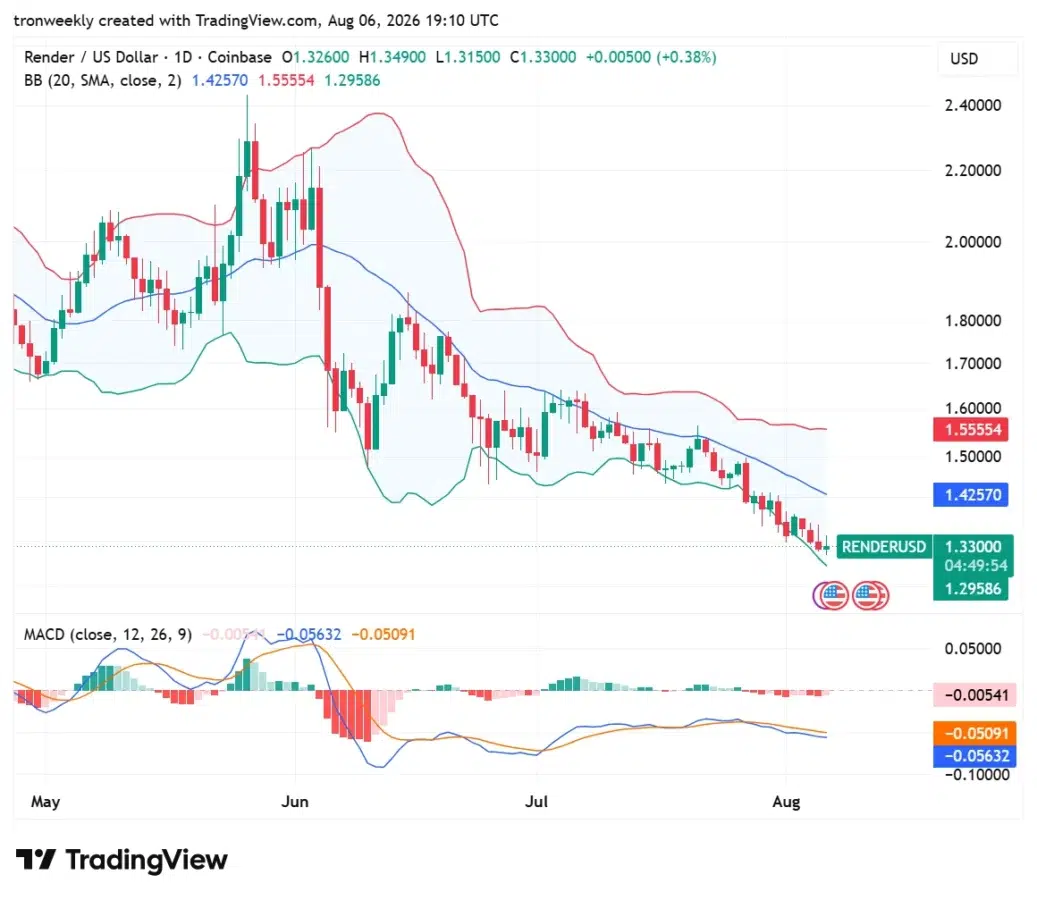
- RENDER remains below the 20-day SMA and near the lower Bollinger Band, reflecting bearish pressure.

The RENDER price is showing signs of a potential bullish reversal after forming a double-bottom pattern, indicating buyers are defending a key support zone. However, bearish momentum remains intact, and a breakout above resistance is needed to confirm a stronger recovery, while losing support could lead to further downside.
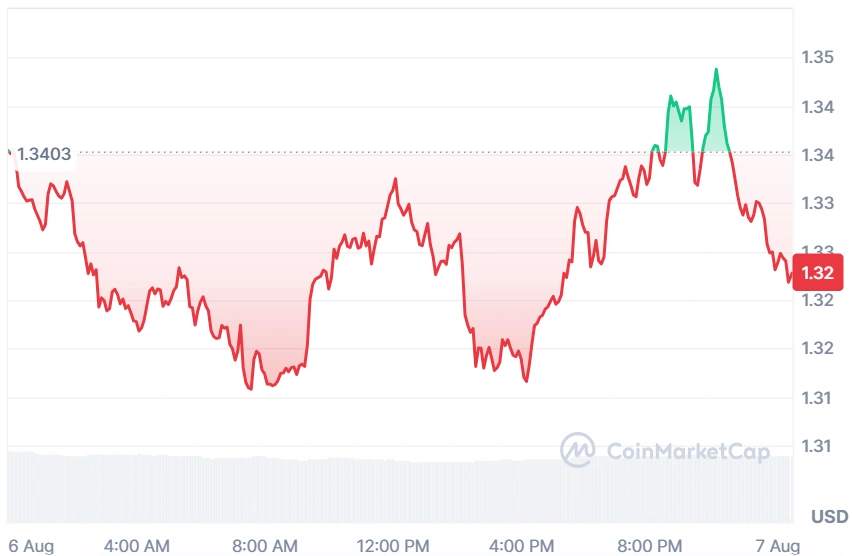
At the time of writing, RENDER is trading at $1.32 with a 24-hour trading volume of $15.2 million and a market capitalization of $688.78 million. Despite the signs of stability over the last 24 hours, the RENDER price structure and institutional demand point to a bullish reversal ahead.
Source: CoinMarketCap

Also Read: RENDER Price Eyes $1.60 Breakout as OTOY Studio Partnership Boosts Adoption
RENDER Price Eyes $1.37 as Double Bottom Forms
According to the crypto analyst Crypto With Gopal, the RENDER price is showing signs of a potential bullish reversal after forming a double-bottom pattern around the $1.315–$1.320 support zone.
The structure suggests buyers are stepping in to defend a critical price floor following recent weakness. Holding this support could strengthen market confidence and increase the likelihood of a sustained recovery in the sessions ahead.
Source: Crypto With Gopal’s X Post
For the bullish case to get confirmed, the RENDER price should reassert itself above the resistance level at the range of $1.343-$1.345, which is the neckline of the chart pattern.
This move would propel the buying force even further, propelling the coin towards its target level of $1.370. The main attention of the market players remains in the present support range.
RENDER Technicals Point to Bearish Pressure
According to TradingView, the RENDER price continues to move in a consistent downtrend with the current price at $1.33 following lower tops and bottoms.
It remains below the 20-day simple moving average and trades close to the lower side of the Bollinger Bands. The first immediate resistance for the stock is seen between $1.43 and $1.56, with support at $1.30.
Source: TradingView
MACD continues to remain below the zero level as the MACD line trades below the signal line, indicating that the bears still have the upper hand.
But the MACD histogram is leveling off, suggesting that the selling may be easing up. Prices moving above $1.43 will improve sentiment, while falling below $1.30 may see prices fall further.
What Happens Next for RENDER?
However, the direction for the RENDER price depends on a simple two-level test: is the $1.30 support level maintained, and can the bulls take advantage of the $1.343–$1.345 resistance level?
Confirmation of the breakout would take the coin to $1.37, whereas a decline below the support level would make the bears walk faster.
Also Read: RENDER Price Targets $50 as Technical Indicators Point to Trend Reversal
This article contains market analysis and price predictions. These are not guarantees. Crypto markets are volatile. Always DYOR. Not financial advice.


Be the first to comment