


Sei (SEI) is moving in a neutral phase with a breakout in sight as the token has broken above the descending channel pattern. According to CoinMarketCap, as of Saturday, April 26, the SEI price has remained stable over the last 24 hours but surged by 11.05% over the last week.
At the time of writing, SEI is trading at $0.06178 with a trading volume of $28.77 million, which has declined by 11.26% over the last 24 hours. However, its market capitalization stands at $430.92 million, which is stable.

Source: CoinMarketCap
Also Read: SEI Price Analysis: Inverse Head & Shoulders Signals Bull Run to $0.50

SEI Bullish Setup Forms After Channel Breakout
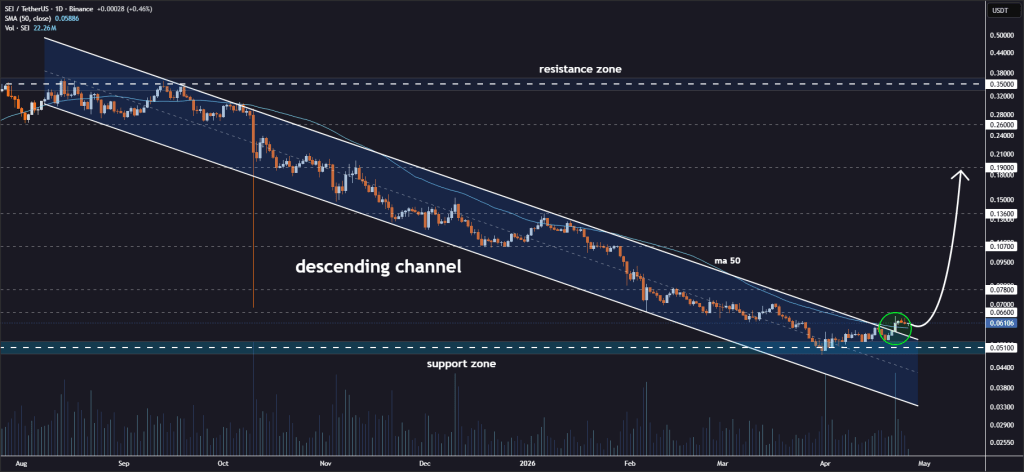
Furthermore, the crypto analyst Jonathan Carter revealed that SEI is attracting attention after a decisive breakout from a descending channel on the daily chart, a structure typically associated with prolonged bearish pressure.
This move suggests a potential shift in trend, as buyers regain control and attempt to establish a stronger foundation above the previously restrictive pattern for now.
Following the breakout, SEI is now consolidating just above the former resistance line, a behavior often interpreted as a retest. In technical terms, this phase helps confirm the breakout’s validity, as the old resistance flips into support.
Such conditions are widely viewed as optimal entry zones, offering traders improved risk management with clearer invalidation levels.
Source: Jonathan Carter’s X Post
If there is continuation in the positive momentum, a number of upside targets have been identified by traders, such as 0.066, 0.078, 0.107, 0.136, and 0.190.
In essence, these levels can be seen as zones of resistance where some price actions will likely play out. Although the volatility cannot be overlooked, the present setup is quite conducive to profit-making.
Momentum Indicators Point to Improving Strength
According to TradingView, the price action of SEI was bearish, declining from levels above $0.120 to below $0.050 until April 2026.
Currently, the price is recovering and creating higher bottoms while breaking out of the resistance zone at $0.060. This indicates a transition from selling to buying activity, with the current price level at $0.06194.

Source: TradingView
Technical indicators confirm this bullish movement. The RSI continues to move higher at 58.68, indicating increasing momentum without being overbought.
Furthermore, the MACD signal line moves above the orange line while generating green bars on the histogram. This often indicates a change in momentum towards a positive one, which could mean that the bullish trend can be sustained.
This article contains market analysis and price predictions. These are not guarantees. Crypto markets are volatile. Always DYOR. Not financial advice.
Also Read: SEI Rally Accelerates After Breakout, Bulls Watch $0.12 Level

Be the first to comment