


What to know:
- SEI holds descending channel support as buyers defend the key zone, price stabilizes short term.
- The downtrend remains active below resistance, the next key support is seen near the $0.045 level.
- Derivatives data rises as RSI recovers slightly and MACD signals easing selling pressure.

As of April 14, 2026, SEI is trading within a range, as price movement is stable around an important technical level. There is steady activity on the market throughout the session, and prices maintain structure on a higher timeframe.
As of writing, SEI trades at $0.05578 on April 14, 2026, recording a 1.36% gain over the past 24 hours. According to CoinMarketCap, weekly performance stayed positive with a 6.32% increase, while trading volume rose 8.69% to $27.96 million, reflecting steady activity.
Also Read: SEI Sees Modest April Bounce: Can Price Climb 10% from Recent Lows?

SEI Holds Descending Channel Support
Price action continues to hold above a key support zone on the higher time frame. Analyst Profit Demon highlighted that SEI remains positioned above the lower boundary of a descending channel on the weekly chart. This level has acted as a base where buyers are stepping in.
The support zone is now a critical area for short-term direction. Sustained holding above this range could allow the price to stabilize. A rebound from this structure would depend on continued demand near current levels.
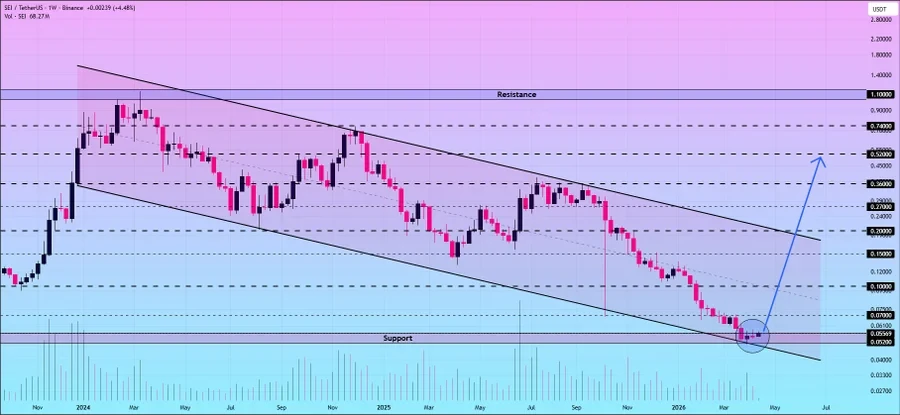

If momentum strengthens, several upside levels are being tracked. These include $0.07, $0.10, $0.15, $0.20, $0.27, $0.36, and $0.52. Each level aligns with prior resistance zones observed during earlier price cycles.
Moreover, another analyst, More Crypto Online, mentioned that SEI remains within a defined downtrend. The price continues to move below a descending resistance trendline, which limits upward movement.
The current structure indicates that resistance remains active. A confirmed break above the trendline is required to shift the trend. Until that happens, downside pressure may persist.
On the lower side, attention remains on the next support zone. The 123.6% Fibonacci extension level near $0.045 is being monitored. This level may act as a reaction point if the price moves lower.
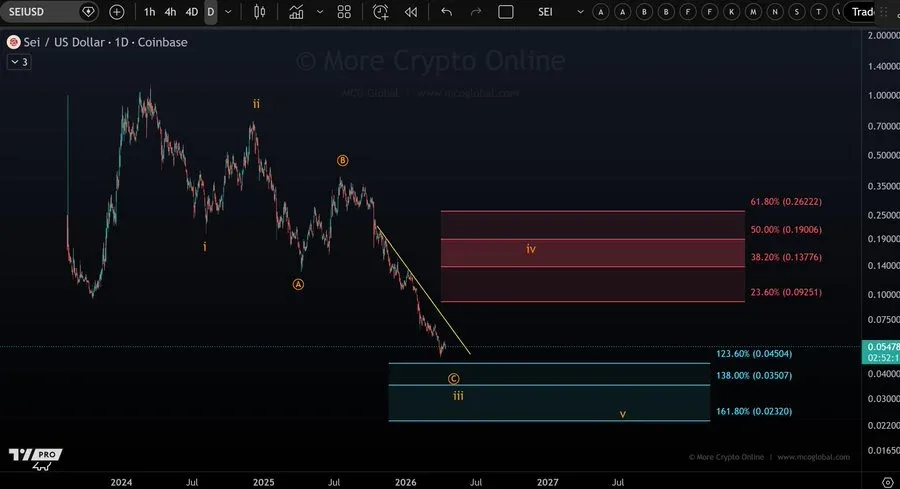

A move toward that level cannot be ruled out under current conditions. However, any reaction would depend on market response at that support. A bounce from that area would still require confirmation.
Futures Volume Jumps as Open Interest Expands
CoinGlass data shows that future volume increased by 26.02% to $64.98 million. Open interest also rose by 4.15% to $54.92 million, signaling fresh positions. The OI-weighted funding rate stands at -0.0157%. This reflects a slight bearish positioning among leveraged traders.
RSI and MACD Signal Easing Selling Pressure
The Relative Strength Index (RSI) is at 46.38, while its moving average is 41.48. It remains below the neutral 50 level, indicating limited strength. However, the move above its average shows easing selling pressure and mild recovery.
The Moving Average Convergence Divergence (MACD) shows a stabilizing structure. The MACD line is at -0.00172, while the signal line is at -0.00248. The histogram reads 0.00075, indicating reduced selling pressure.
This article contains market analysis and price predictions. These are not guarantees. Crypto markets are volatile. Always DYOR. Not financial advice.
Also Read: Zcash (ZEC) Builds Bullish Structure as Traders Eye $450 Resistance Target

Be the first to comment