



Sei price is now trading in a narrow range around $0.072 following a steep rally in late September, while derivatives activity remains elevated.
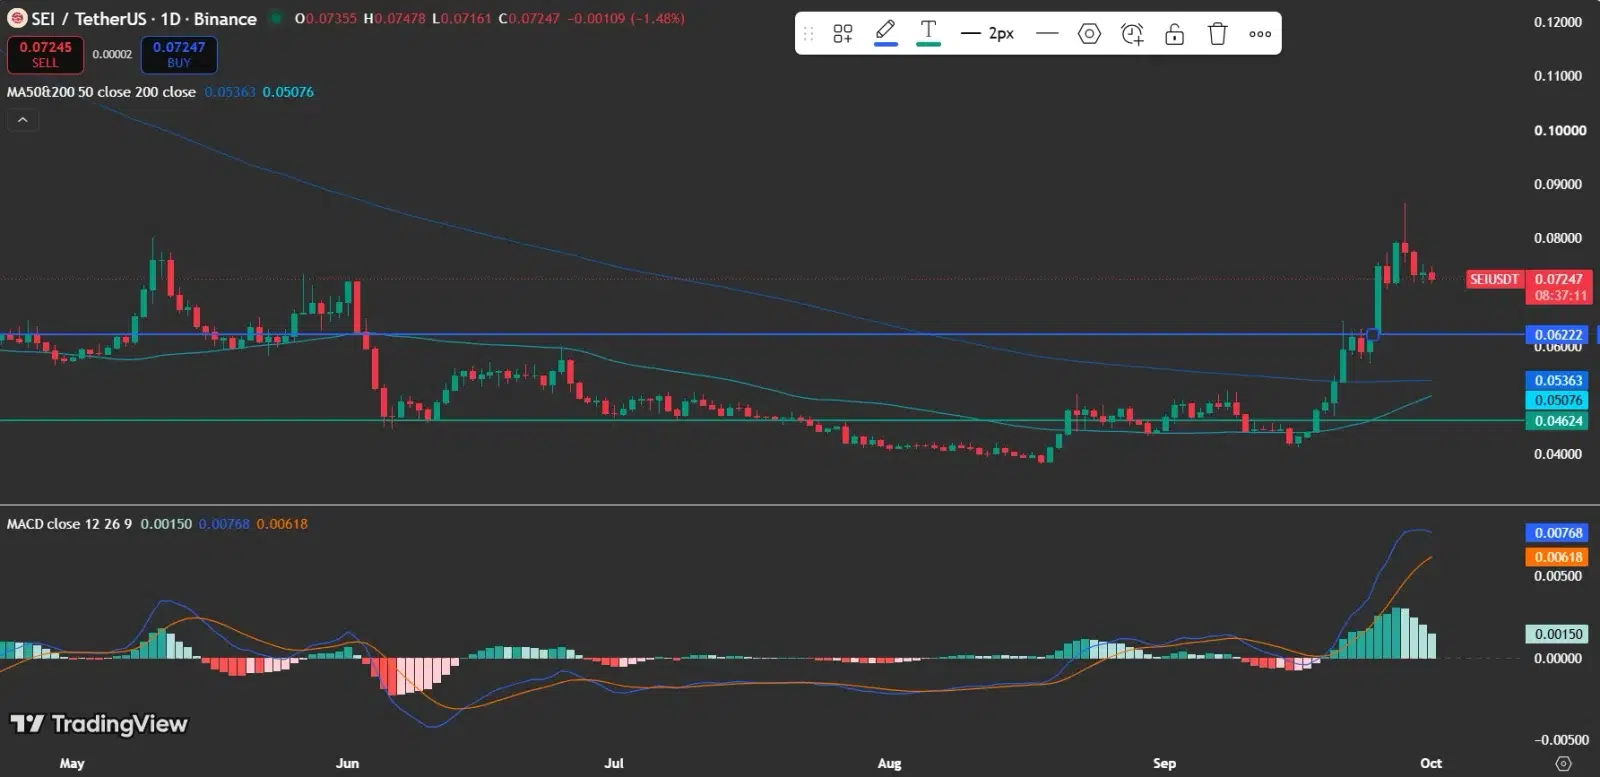
As of press time, Sei is changing hands at $0.07247, down 1.48% over the last 24 hours. This latest movement follows SEI’s climb past the $0.06222 mark and a brief push into the $0.08 region, according to the supplied TradingView chart.
Also Read: SEI Price Gains Momentum as Sei Network Advances Staked ETF Plan
What Is Shown on the Sei Price TradingView Chart?
On the daily chart, SEI is trading significantly above both its 50-day and 200-day moving averages, which sit at $0.05363 and $0.05076, respectively. This keeps the broader chart structure above those longer-term trend references, even after the most recent daily drop.

The $0.06222 level has now emerged as a key nearby reference point. Holding firmly above it would preserve the recent breakout structure, whereas slipping below it could shift attention back to the lower moving-average band of $0.05363–$0.05076.
Can Sei Price Maintain Its Momentum?
The MACD is still positive, with the MACD line at 0.00768 sitting above the signal line at 0.00618. The positive histogram indicates that bullish momentum is still in play, even though the most recent bars have begun to shrink from their earlier expansion.
Taken together, this implies momentum has not completely reversed, yet the cooling histogram suggests room for consolidation following September’s strong advance.
Also Read: SEI Price Eyes Breakout to $0.34 as Network Activity Strengthens Outlook
How Does Hermes Influence Sei Price?
Sei Network unveiled Hermes, which it describes as a consensus protocol built for Sei Giga and reports a median latency of 68ms. According to the project, Hermes is meant to lower latency and jitter relative to existing blockchain systems.
The project described Hermes as “The fastest consensus protocol ever published” and said it is designed to provide “lower latency and jitter” for Sei Giga.
This announcement provides a fundamental development to watch alongside the recent price action, especially since it ties directly to Sei’s planned high-performance infrastructure. The information provided does not prove that Hermes was the cause of the recent price movement.
What Do Sei Price Open Interest and Volume Indicate?
CoinGlass data reveals that Sei open interest climbed sharply throughout late September, surpassing $110 million before easing to around $95 million. Trading volume also grew considerably, with the chart displaying a late-September peak above $700 million.
A rise in both metrics suggests that the latest price movement has come with increased market activity. This also suggests that if SEI moves back toward its recent peaks, derivatives positioning may become increasingly significant.
Also Read: SEI Price Eyes Breakout Toward $0.80 as Network Ecosystem Expands
Which Factors Should Traders Keep an Eye On Next for Sei Price?
In the near term, the chart structure hinges on $0.06222 as the key support level, while the $0.08 area continues to serve as the recent upside benchmark.
Remaining above $0.06222 would keep the existing breakout structure intact; a drop below it would undermine that setup and bring the moving-average zone around $0.05363 and $0.05076 into view.
Sei’s Hermes development offers a fundamental catalyst that traders can track alongside price and derivatives data.
Cryptocurrency markets are still subject to sharp swings, so traders ought to review price action, market sentiment, and upcoming catalysts prior to making any investment choices.
Also Read: Sei Price Rises After Giga Architecture Test Records 63,000 Requests per Second
This article contains market analysis and price predictions. These are not guarantees. Crypto markets are volatile. Always DYOR. Not financial advice.



Be the first to comment