



SEI has recovered from its latest dip below $0.0623, but buyers still need to overcome the descending channel that has contained the retreat from September’s peak.
Key Takeaways
- SEI is trading around a repeatedly tested $0.0623 support area.
- The descending channel and $0.068 retracement are the nearest recovery hurdles.
- The rising 50-day average sits below price at $0.05794.
- RSI is near 50, showing that momentum has cooled substantially.
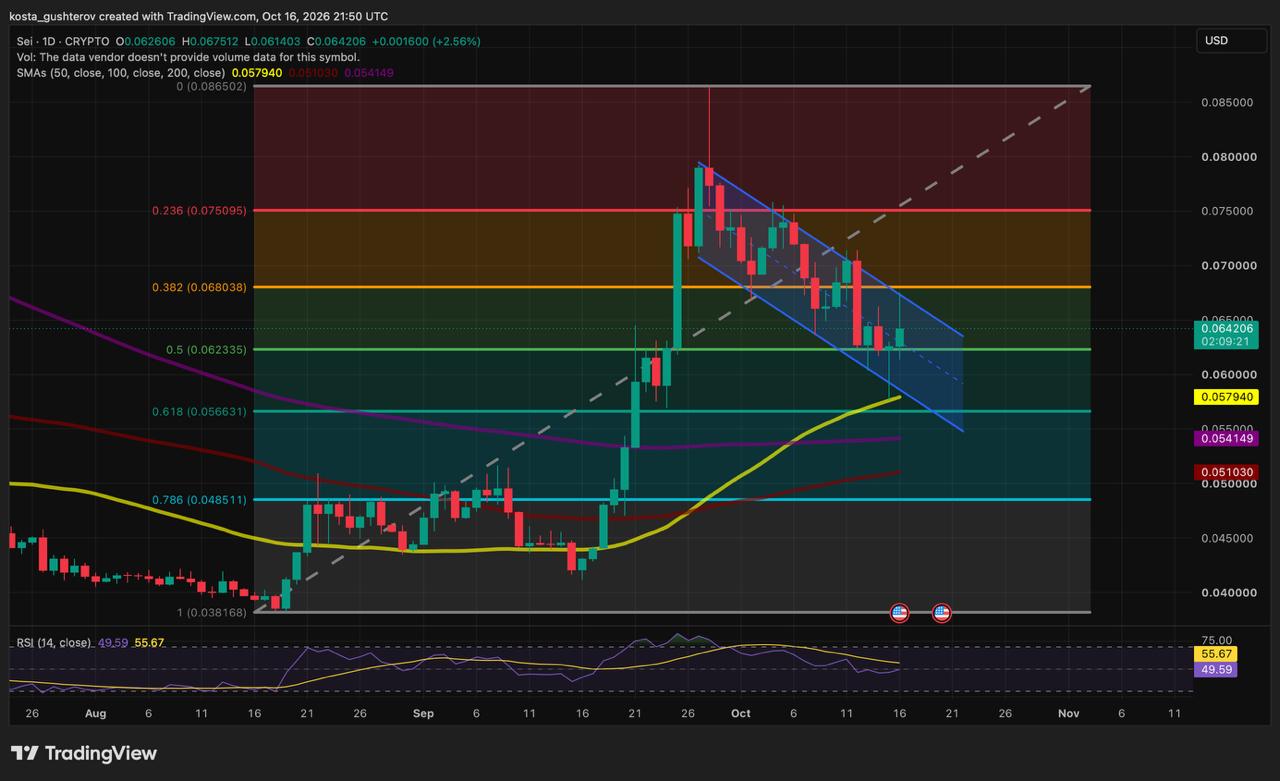
The SEI/USD daily chart on TradingView showed price at $0.0642 on October 16 at 21:50 UTC, up 2.56% on the open daily candle. SEI traded between $0.061403 and $0.0675 during the session before pulling back from its intraday high.
Buyers return around the midpoint of the August-September rally
The Fibonacci retracement measures SEI’s advance from the August low of $0.038168 to the late-September high of $0.086502. Even after falling roughly 26% from that peak, SEI remains about 68% above the starting point of the move.
The rally accelerated in late September after price moved above its moving averages. Since then, the chart has produced lower highs and lower lows within the blue descending channel. The latest green candle represents a recovery inside that correction, not yet a break from the falling structure.
The 50% Fibonacci retracement at $0.062has become the immediate level to watch. Several recent candles have traded around it, often leaving lower wicks below the line before recovering. The latest session followed the same pattern, slipping beneath the level before returning above it.
That activity gives $0.0623 more significance than a Fibonacci calculation alone. The area also overlaps with trading from September’s advance before the sharp move higher. Buyers have returned there repeatedly, but the intraday breaks show that the level is being tested rather than defended cleanly.
A daily close above $0.062 would preserve the recovery from the latest low. The more meaningful improvement would be a series of higher lows afterward, which would show that selling pressure is easing rather than merely pausing at support.
The channel ceiling stands between SEI and a stronger recovery
The latest intraday high near $0.0675 approached the descending channel’s upper boundary. Just above it sits the 38.2% Fibonacci retracement at $0.068038. Together, they create a nearby resistance area around $0.0675–$0.0680, although the channel line continues to move lower over time.
Breaking through the channel would interrupt the recent pattern of lower highs. Recovering $0.0680 and then holding it through a pullback would offer stronger evidence that buyers are retaining ground lost during the correction.
Above that area, the 23.6% retracement at $0.075095 becomes the next horizontal resistance reference. October candles have already met selling around that band before the decline continued. The measured peak at $0.086502 would only return to focus after SEI cleared those nearer barriers.
The upward-sloping dashed line from the August base provides a comparison with the earlier rally. Price has fallen beneath that path, showing how sharply the pace of the advance has slowed. It does not create a second rising channel alongside the blue descending structure.
The moving averages still reflect the August recovery
The 50-day simple moving average is rising near $0.057940 and remains below the current price. It becomes a potential support reference if SEI loses $0.0623 and moves toward the lower portion of the descending channel.
The 61.8% Fibonacci retracement sits at $0.056631, just below the 50-day average. Those levels are close enough to assess together during a deeper pullback, but they remain separate references. Their proximity alone does not create a demand zone unless price produces a convincing response there.
The longer averages need a more careful reading. The 200-day SMA stands at $0.054149, above the 100-day SMA at $0.051030. While the 50-day average sits above both, this is not yet a fully bullish alignment of the 50-day, 100-day and 200-day averages.
The chart therefore still shows a strong recovery from the August base, while the longer averages retain the imprint of the previous weakness. SEI remains above all three averages, giving the correction support references below price, but the descending channel continues to cap the rebound overhead.
Momentum has cooled, while volume confirmation is unavailable
The daily relative strength index, or RSI, reads 49.59, below its smoothing line at 55.67. The indicator has retreated from its late-September highs toward the neutral midpoint of 50, matching the loss of upward momentum during the correction.
The latest price recovery has been accompanied by a small turn higher in RSI, but the indicator does not yet show a clear bullish momentum advantage. A sustained move above 50 alongside a channel breakout would offer stronger confirmation than either development on its own.
The chart’s data provider does not supply volume for this symbol. It is therefore not possible to determine whether the recovery is being accompanied by expanding trading activity, or to attribute the buying to institutions.
Holding support and escaping the channel require different evidence
The constructive scenario begins with SEI retaining the $0.0623 area, then closing above the descending channel and $0.0680. If buyers subsequently defend the recovered area, $0.0751 becomes the next resistance reference. A move back toward $0.0865 would require another recovery beyond that level.
A rejection near the channel ceiling would leave the correction intact even if $0.0623 continues to attract buyers. Repeated movement between those two boundaries would amount to consolidation inside the descending structure.
If SEI instead closes below $0.0623 and cannot recover it, attention would turn to the 50-day SMA and the $0.0566 retracement. Further losses would expose the 200-day and 100-day averages before the deeper $0.0485 Fibonacci level. The August low would become relevant only after those nearer references were lost.
This article is provided for informational purposes only and does not constitute financial or investment advice. Technical levels and indicators do not guarantee future price movements.

Kosta has reported on cryptocurrency markets and blockchain infrastructure since 2020, bringing over six years of hands-on experience in the crypto industry built through daily tracking of markets, trends, and emerging blockchain developments. Specializing in Bitcoin on-chain analysis, institutional ETF flows, and digital asset price action, his work at Coindoo has been cited by other news agencies and consistently covers market developments with a focus on data-driven reporting across Bitcoin, Ethereum, Solana, and XRP.
Over the years, Kosta has contributed to multiple crypto media outlets in different regions, authoring over 6,000 articles across the sector. His reporting spans cryptocurrency markets and the broader fintech industry, tracking not only price action but also the technological and regulatory forces shaping the ecosystem.
To support his analysis, Kosta actively leverages on-chain data and metrics from leading platforms such as Santiment, Glassnode, and CryptoQuant, enabling deeper, evidence-based market insights. He believes in the power of transparency and the data that underpins the blockchain ecosystem.
His academic background in Marketing Management from Denmark further complements his analytical approach, adding a strong understanding of communication strategy and content positioning to his work.


Be the first to comment