



What to know:
- Shiba Inu (SHIB) forms a falling wedge, signaling bearish exhaustion and possible bullish reversal on breakout.
- Despite a 3.64% drop, SHIB shows accumulation as buyers defend key support zones.
- MACD confirms bearish momentum, with price below zero and sellers in control.

Shiba Inu is forming a falling wedge, indicating weakening bearish pressure and possible accumulation near support. A breakout could signal a reversal for the SHIB price, but the trend remains bearish with strong downside momentum. Despite higher trading activity, cautious sentiment persists due to reduced speculative positioning.
At the time of writing, SHIB is trading at $0.055298 with a 24-hour trading volume of $175.12 million and a market capitalization of $3.12 billion. After the 3.64% loss over the last 24 hours, the question is whether the SHIB price could maintain its momentum.
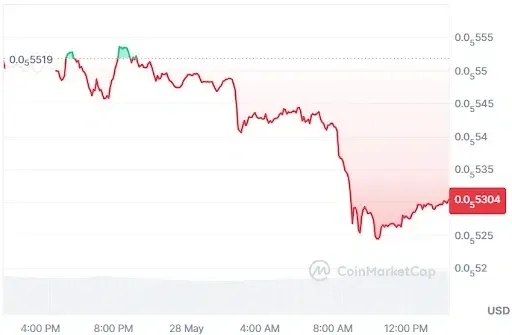

Source: CoinMarketCap

SHIB Price Could Surge to $0.000042 If Pressure Eases
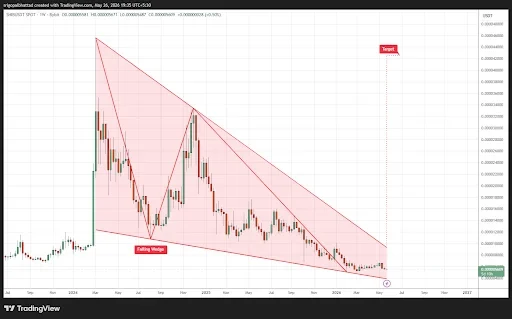
Furthermore, the crypto analyst Whales Care revealed that the SHIB price is forming a notable falling wedge on the weekly chart, a structure often linked to bearish exhaustion and potential bullish reversal.
The SHIB price has been trending downward inside tightening, converging lines, while volatility contracts and selling pressure weakens. Buyers continue defending long-term support zones, signaling accumulation beneath the ongoing corrective phase.

Source: Whales Crypto’s X Post
The emergence of a breakout above the resistance of the wedge formation could trigger a dramatic change in momentum, thereby resulting in a possible reversal in the trend.
With high trading volumes, the calculated upside targets imply that the price will head towards $0.000042. Prior to any confirmation, it must be noted that the SHIB price is in consolidation, and confirmation is key at this point.
Also Read: SHIB Added to SBI Lending Program With 2%-5% APY Range
SHIB Price Structure Points to Downward Pressure
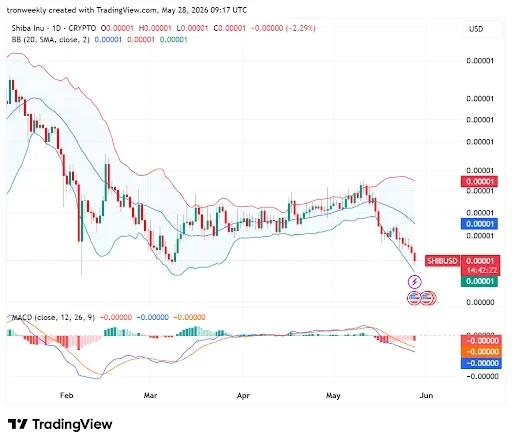
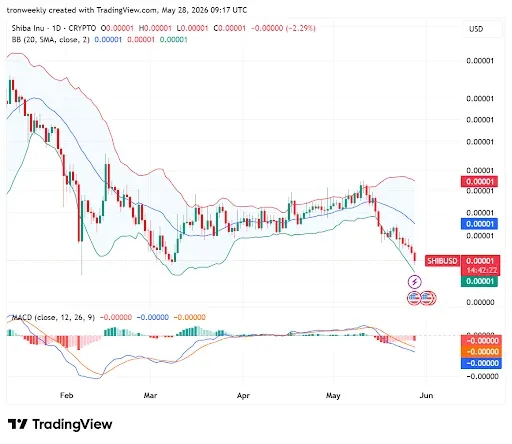
According to TradingView, the SHIB price starts to show significant bearish bias from the month of February onwards, but a consolidation phase follows thereafter.
Yet again, in late May, due to further sell-offs, price bars started falling aggressively to touch the bottom end of the Bollinger band. The above behavior confirms strong bearish momentum pushing the SHIB price to fall back to previous support levels.
Source: TradingView
MACD validates the escalating downward momentum. Both the MACD and signal lines are trading solidly below the zero line.
The expanding histogram bars together with the current technicals suggest a trend reversal to the downside, signaling an escalation of bearish power with sellers dominating the market going forward, especially as June draws near.
Rising Volume Point to a Shift in Momentum
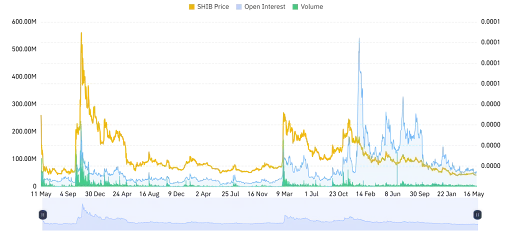
However, SHIB’s volume increased to 41.02% to stand at $107.90 million, indicating increased volumes and higher levels of participation in the market. The increase in volume shows that there is more liquidity in the market, thus increasing investor participation in the market.

Source: Coinglass
There is a 4.83% drop in open interest to $46.62 million, meaning that there is less position-taking in derivatives and fewer outstanding trades. This could mean a relatively more cautious outlook and possibly a decrease in leveraging activities, given the prevailing conditions.
This article contains market analysis and price predictions. These are not guarantees. Crypto markets are volatile. Always DYOR. Not financial advice.
Also Read: Shiba Inu (SHIB) Falling Wedge Pattern Sparks 440% Rally Speculation



Be the first to comment