



Shiba Inu (SHIB) faces growing bearish pressure as a rising wedge signals weakening momentum. A breakdown could trigger further downside, while technical indicators show cooling buying strength. However, buyers may invalidate the bearish setup if they successfully defend the key trendline support.
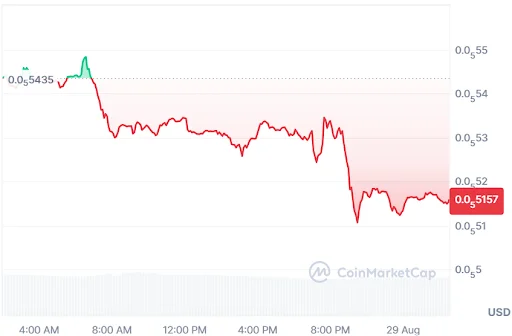
At the time of writing, SHIB is trading at $0.000005153 with a 24-hour trading volume of $82.37 million and a market capitalization of $3.03 billion. Following the 4.79% loss over the last 24 hours, the SHIB price structure and cooling momentum point to a bullish reversal ahead.
Source: CoinMarketCap
Also Read: SHIB Price Breakout and Billion-Token Burns Boost Shiba Inu Momentum

SHIB Eyes $0.00000520 as Bearish Setup Emerges
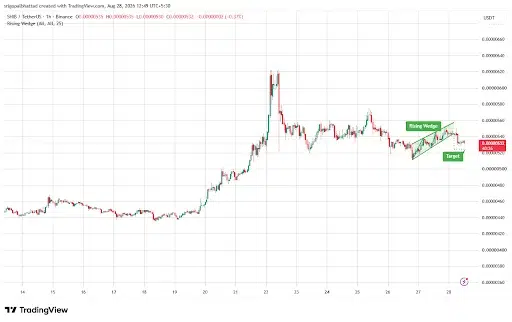
According to the crypto analyst Crypto With Gopal, Shiba Inu (SHIB) is approaching a potentially important technical turning point as the SHIB chart forms a rising wedge near resistance.
The pattern suggests that buying momentum may be losing strength after the recent advance. If sellers gain control and price fails to hold the lower trendline, the structure could develop into a bearish reversal.
Source: Crypto With Gopal’s X Post
If the price breaks down decisively through the wedge support, then this would validate the bears’ case and could set SHIB up for even more declines.
The critical level for this scenario to play out is $0.00000520. Meanwhile, traders are looking at the trendline to see if the bulls can protect it.
Technical Indicators Point to Cooling-Off Period
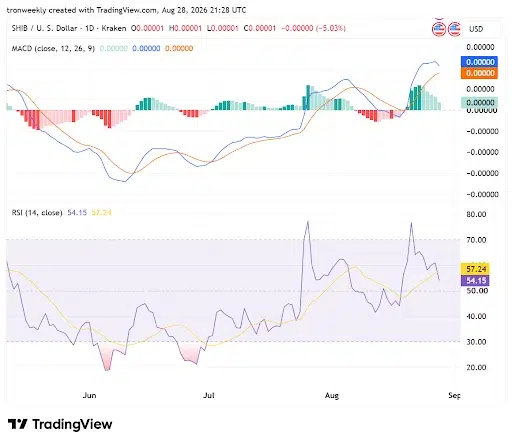
The data from TradingView further highlighted that the daily SHIB chart displays a bullish MACD setup as the MACD line is above the signal line after an uptrend crossover.
The histogram is positive as well, reaffirming the bullish trend. Yet, narrowing bars on the histogram indicate that buying momentum is waning, implying that momentum can be even weaker if selling takes control.
Source: TradingView
Currently, the RSI is at 54.15, well above the neutral level of 50 but still far away from being overbought, as it is under 70.
It shows a slightly bullish trend, but there is no buying pressure on the market. At the same time, the RSI has fallen off its high, although its moving average is close to 57.24.
What Happens Next for SHIB?
The price movement of Shiba Inu will be determined by the ability of the bulls to defend the lower trend line of the rising wedge pattern.
Failure to do so will strengthen the bears and make it possible for the price of SHIB to reach $0.00000520. The level of volume, RSI, and MACD will confirm the breakout of the pattern.
Also Read: SHIB Price Nears Critical Resistance With $0.000030 Target in Focus
This article contains market analysis and price predictions. These are not guarantees. Crypto markets are volatile. Always DYOR. Not financial advice.



Be the first to comment