


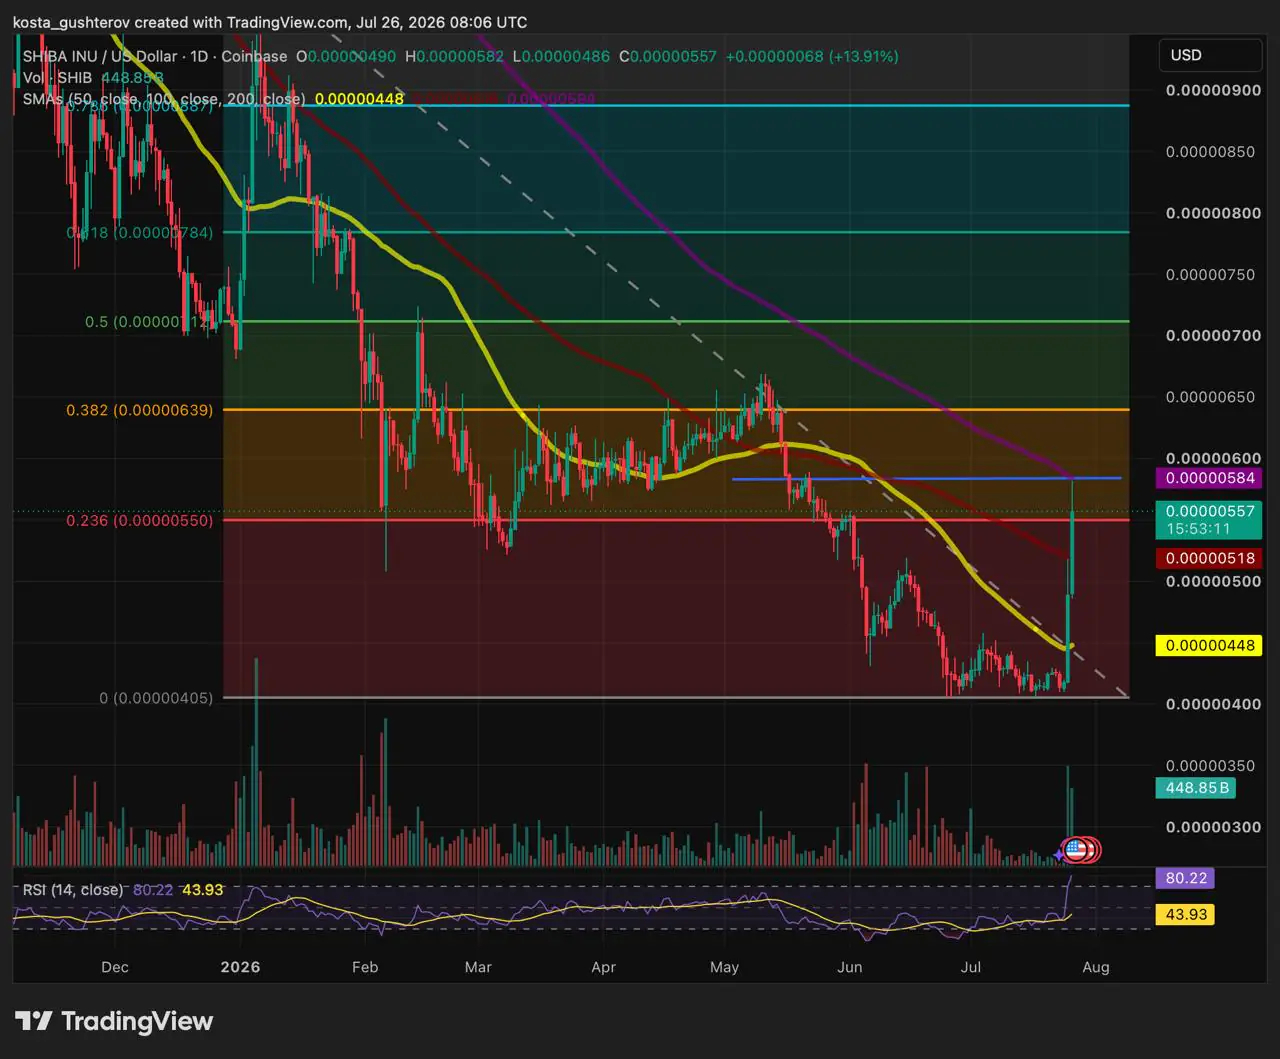
Shiba Inu extended its breakout for a second straight session, climbing from an open near $0.000005 to an intraday high of $0.0000058 – a gain of roughly 15% on the day – before easing to close near $0.0000056.
Key Takeaways
- Two-session gains now total roughly a third of SHIB’s value.
- Short liquidations outpaced longs by more than 2.5 times over 24 hours.
- Futures volume dwarfs spot activity across major exchanges.
The high landed almost exactly on the 200-day SMA at $0.00000584, the last major moving average still above price, while the close held above both the 100-day SMA ($0.00000519) and the 0.236 Fibonacci retracement ($0.0000055) that capped the prior session.
Combined with the previous day’s 18% surge, SHIB has now gained roughly a third of its value in two sessions – a sharp move that’s cleared two resistance levels in a row but also pushed the 14-day RSI to approximately 81, deep into overbought territory.
Shorts Are Bearing the Cost of the Squeeze
Liquidation data from Coinglass shows the rally has been punishing for leveraged short positions. Over the past 24 hours, roughly $2.65 million in SHIB positions were liquidated, and short positions accounted for about $1.93 million of that – more than 2.5 times the losses on the long side. The imbalance was sharper over the most recent 4-hour window, where shorts made up roughly $508,000 of $773,000 in liquidations.
Funding rate data adds context to that squeeze. SHIB’s OI-weighted funding rate had already turned consistently positive through much of July, with the largest spikes clustering in the days immediately before this week’s advance. Positive funding means leveraged longs were paying a premium to hold their positions – a sign that bullish positioning was already building in the derivatives market ahead of the breakout, which likely amplified the move once price cleared the 100-day SMA and forced shorts to cover.
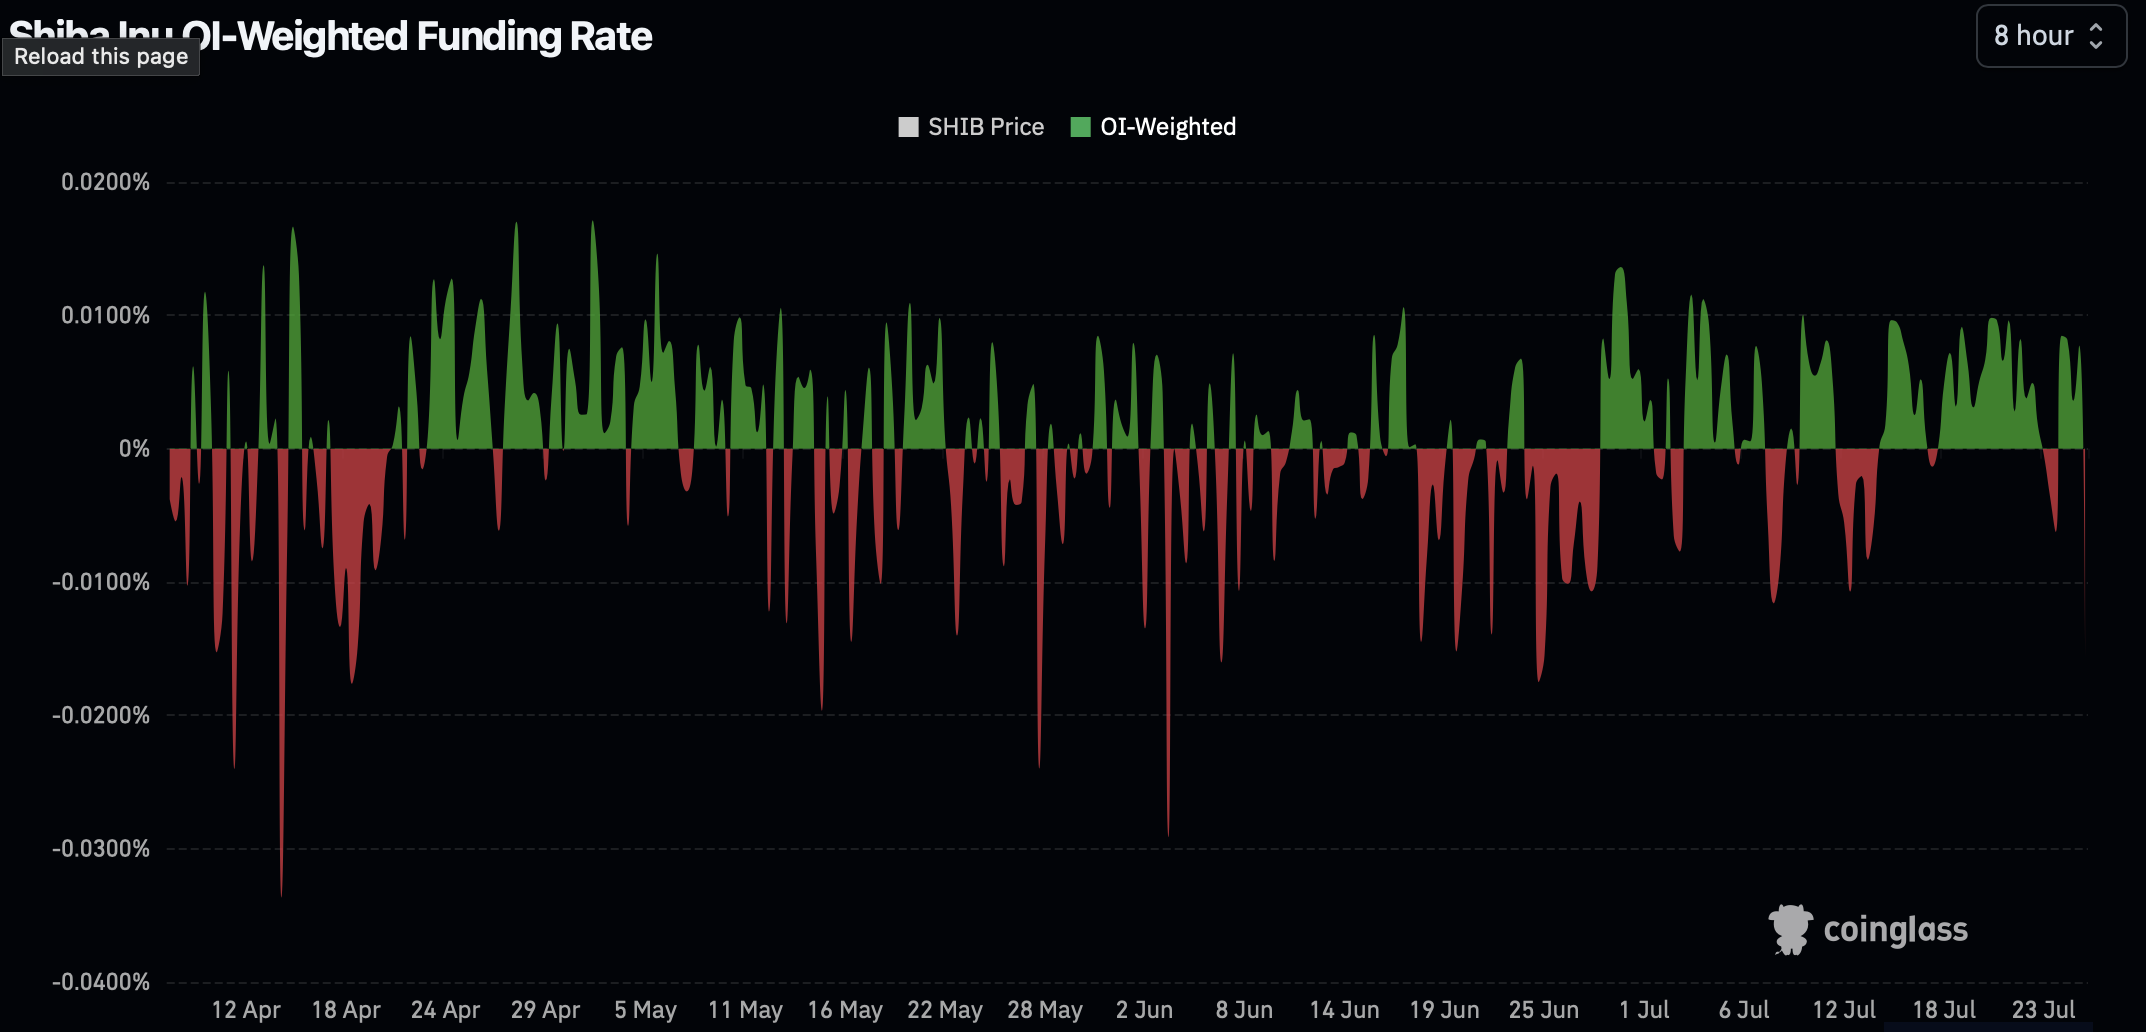
Together, the liquidation skew and the funding trend point to a rally with a substantial leverage component. That doesn’t rule out genuine spot demand, but it does mean part of the advance reflects forced buying rather than new conviction alone.
Futures Volume Dwarfs Spot Activity
Exchange data shows the bulk of trading activity is happening in derivatives rather than spot markets. Spot volume is led by Upbit (~$57.6 million) and Binance (~$41.6 million), with OKX, Bybit, Gate and Coinbase trailing well behind. Futures volume on OKX alone reached approximately $432 million, more than seven times its own spot total and roughly ten times the combined spot volume across all listed exchanges.
That concentration in futures markets is consistent with the liquidation and funding signals pointing to a leverage-heavy move.
The 200-Day SMA Is Now the Level to Watch
With the 100-day average and the 0.236 Fibonacci retracement both cleared, the 200-day SMA at $0.00000584 is the next structural test, and this session’s high already touched it before price pulled back. That level carries extra weight because it lines up almost exactly with horizontal resistance from SHIB’s February consolidation high, giving the zone confirmation from both a moving average and prior price action rather than the SMA alone.
A daily close above that confluence would be the first since SHIB’s decline began, and would open room toward the 0.382 Fibonacci retracement near $0.00000639. Rejection at the 200-day would leave the rally similar to the prior session’s outcome at the 100-day: a resistance test without confirmation. In that case, the reclaimed 100-day SMA near $0.00000519 becomes the first level to hold, followed by the 0.236 Fibonacci retracement near $0.0000055.
An RSI reading above 80 raises the odds of consolidation or a pullback before any further extension, regardless of which side of this level the daily candle ultimately closes on. Two consecutive sessions of double-digit gains, both driven substantially by futures activity, is the kind of move that typically needs time to digest before it can be read as a durable trend change rather than a leverage-fueled spike.
- Disclaimer: This article is for informational and analytical purposes only and does not constitute financial or investment advice. SHIB is a volatile asset, and technical indicators or historical price patterns cannot guarantee future performance. Readers should conduct their own research before making financial decisions.
- Methodology: Technical levels are based on the daily SHIB/USD Coinbase chart via TradingView, captured July 26, 2026. Liquidation, funding rate and exchange volume data are from Coinglass.

Kosta has reported on cryptocurrency markets and blockchain infrastructure since 2020, bringing over six years of hands-on experience in the crypto industry built through daily tracking of markets, trends, and emerging blockchain developments. Specializing in Bitcoin on-chain analysis, institutional ETF flows, and digital asset price action, his work at Coindoo has been cited by other news agencies and consistently covers market developments with a focus on data-driven reporting across Bitcoin, Ethereum, Solana, and XRP.
Over the years, Kosta has contributed to multiple crypto media outlets in different regions, authoring over 6,000 articles across the sector. His reporting spans cryptocurrency markets and the broader fintech industry, tracking not only price action but also the technological and regulatory forces shaping the ecosystem.
To support his analysis, Kosta actively leverages on-chain data and metrics from leading platforms such as Santiment, Glassnode, and CryptoQuant, enabling deeper, evidence-based market insights. He believes in the power of transparency and the data that underpins the blockchain ecosystem.
His academic background in Marketing Management from Denmark further complements his analytical approach, adding a strong understanding of communication strategy and content positioning to his work.


Be the first to comment