



Solana apps top $17M weekly revenue, lead for ninth straight quarter, and record $4.15B in 24-hour DEX volume.
Solana protocols generated more than $17 million in app revenue last week, according to market updates. The figure placed Solana ahead of other blockchain networks by weekly application revenue.
The network also led all chains for the ninth straight quarter by app revenue performance. Pump generated the highest revenue, while Collector Crypt ranked second among Solana apps.
MSB Intel reported that Solana led all blockchains in 24-hour decentralized exchange volume. The reported daily DEX volume reached $4.15 billion, with BNB Chain and Robinhood Chain following.

The activity comes as SOL trades near $76.77 on Coinbase’s daily chart. Price has rebounded from recent lows, but $89 to $90 remains key resistance.
Solana Apps Keep Revenue Lead
Solana’s app revenue crossed $17 million during the latest weekly reporting period. App revenue means fees earned by applications running on a blockchain. This metric helps measure user activity across different networks.
🚨SOLANA APPS CRUSH IT AGAIN: $17M+ REVENUE LAST WEEK, LEADING ALL CHAINS FOR 9TH STRAIGHT QUARTER!
Solana protocols generated over $17 million in App revenue, outperforming every other blockchain.
Pump dominated, Collector Crypt took second. pic.twitter.com/uHBqMwGgCQ
— Crypto Banter (@crypto_banter) July 14, 2026
Pump led Solana’s weekly app revenue, according to the market update. Collector Crypt followed in second place among the listed Solana protocols. Their rankings show that user-facing apps remain active across the network.
The ninth straight quarterly lead adds more context to Solana’s current position. It shows that application revenue has stayed strong across several reporting periods. However, revenue strength does not always lead to immediate SOL price gains.
DEX Volume Adds More Network Activity
MSB Intel reported that Solana led all blockchains in 24-hour DEX volume. The reported volume reached $4.15 billion during the latest daily period. BNB Chain and Robinhood Chain followed behind Solana in the ranking.
BREAKING: Solana led all blockchains in 24-hour DEX trading volume at $4.15 billion.
BNB Chain and Robinhood Chain followed. Solana now ranks first across daily volume, fees, and RWA adoption, three consecutive weeks atop all metrics. pic.twitter.com/mGWi4Bgzml
— MSB Intel (@MSBIntel) July 14, 2026
DEX volume measures trading on decentralized exchanges, where users swap assets directly onchain. Higher volume can point to stronger liquidity and active market demand. It can also come from meme coins, stablecoins, and newer tokens.
MSB Intel also said Solana ranked first in daily volume, fees, and RWA adoption. The report said Solana has led those metrics for three straight weeks. RWA means real-world assets represented through blockchain-based systems.
Read also – Solana Could Surge to $127 If It Clears This Critical Resistance: Analysis
SOL Price Tests Recovery Setup
The daily SOL/USD chart on Coinbase shows SOL trading near $76.77. The chart showed a 2.48% gain at the time of the snapshot. Price has bounced, but it remains below its main recovery zone.
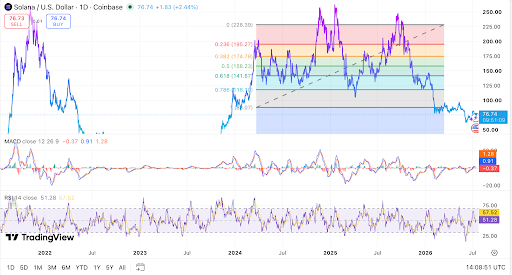
The first resistance sits near the $80 to $85 range. Above that, traders are watching the $89 to $90 zone closely. A daily close above $90 would improve the short-term setup.
The next upside level sits near $118.10 on the chart. On the downside, support remains near $72, then $65 and $60. Traders may watch revenue, DEX volume, and price confirmation together.



Be the first to comment