


The Solana price has demonstrated massive strength after rising above $82. Although the bulls have gained enough traction, the shift happening beneath the surface has been a major catalyst. Alongside this, the token is also outperforming Bitcoin, which usually attracts stronger capital inflows across the broader market. With this, the SOL price is believed to have entered a transitional phase that has historically marked an early foundation of larger trend reversals.
However, the crucial resistance currently lies around $95, and if the bulls manage to break above the range, it could define the next major trend.
SOL/BTC Breakout Attempt Signals Improving Relative Strength
The SOL/BTC pair is pushing toward the upper boundary of a long-term falling wedge. This has kept the token under pressure since late 2024, while the latest weekly candle suggests buyers are attempting to break the trend and shift the momentum. Currently, it is trading near 0.00134 BTC, just below the critical breakout zone around 0.0014 to 0.00145 BTC, and a decisive breakout above this range could trigger a strong SOL price rally.
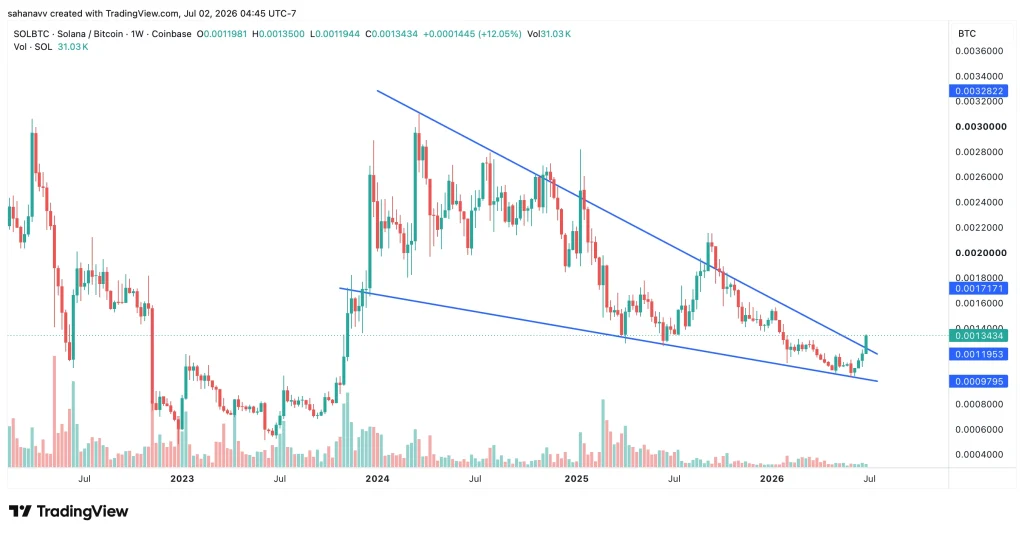
Historically, breakouts in the SOL/BTC pair have acted as an early signal of broader capital rotation into Solana, often preceding stronger upside in the SOL price itself. However, the breakout is not confirmed yet. If SOL/BTC fails to clear the wedge resistance, the pair could revisit the lower support near 0.0010 BTC, delaying Solana’s recovery and keeping Bitcoin dominance in control for longer. For now, the market is watching closely, as this breakout attempt could determine whether Solana becomes one of the leaders in the next altcoin rotation.


SOL Price Remains Below Value Area Despite Recovery Efforts
While Solana is displaying strength against Bitcoin, the SOL/USDT pair displays weakness. The price is trading near $82 and struggling to reclaim key lost support levels. After breaking below the critical $95–$100 zone, Solana remains under pressure and is still trading far below its major value area, where the highest trading activity has historically occurred.
The Volume Profile highlights a dense high-volume cluster between $135 and $150, with the point of control (POC) sitting near this region. This suggests that the market still considers this range as Solana’s fair value, while the current price remains heavily discounted.
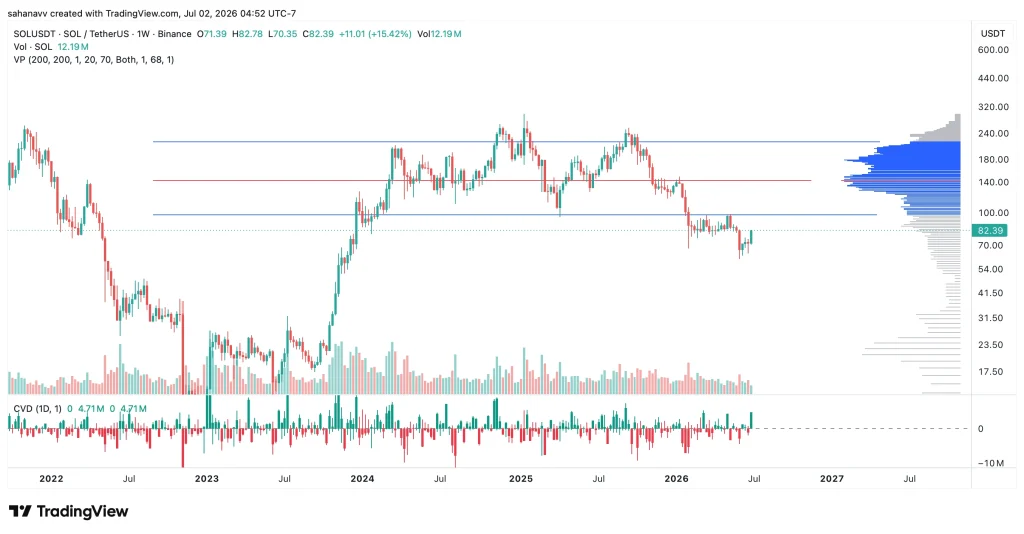
At the same time, the Cumulative Volume Delta (CVD) remains relatively flat, indicating that spot buying activity has yet to return aggressively. This is a crucial signal, as sustainable rallies are often backed by stronger spot accumulation rather than leveraged-driven moves. For now, the immediate focus remains on the $95–$100 resistance zone.
A successful reclaim of this level could strengthen the recovery structure and open the path toward the $140–$150 value area. However, failure to break above it may keep SOL range-bound and vulnerable to another pullback toward the $75–$78 support region.
Why Solana Could Be Entering a Transition Phase
The current divergence between the SOL/BTC and SOL/USDT charts suggests Solana may be entering a transition phase—one where relative strength begins improving before the USD price fully confirms a reversal. This is often how major trend shifts begin, with capital rotating into stronger assets against Bitcoin before broader spot demand pushes prices higher in dollar terms.
The improving structure on the SOL/BTC pair shows that Solana is beginning to attract capital faster than Bitcoin, which is typically an early sign of altcoin leadership. Historically, such breakouts have often preceded stronger rallies in the SOL price itself.
However, the SOL/USDT chart shows that this transition is still incomplete. Price remains below the key $95–$100 resistance and far from the major value area near $140–$150, while spot demand remains relatively weak. This means the market is showing early signs of strength, but the full bullish confirmation is still missing.
Key Levels to Watch
- $75–$78 → Immediate support zone
- $95–$100 → Critical reclaim zone
- $140–$150 → Major value area / primary upside target
- $200–$220 → Strong macro resistance
- 0.0014–0.00145 BTC → SOL/BTC breakout confirmation
- 0.0010 BTC → Key downside support on SOL/BTC
Was this writing helpful?
Story Ends Here
Trust with CoinPedia:
CoinPedia has been delivering accurate and timely cryptocurrency and blockchain updates since 2017. All content is created by our expert panel of analysts and journalists, following strict Editorial Guidelines based on E-E-A-T (Experience, Expertise, Authoritativeness, Trustworthiness). Every article is fact-checked against reputable sources to ensure accuracy, transparency, and reliability. Our review policy guarantees unbiased evaluations when recommending exchanges, platforms, or tools. We strive to provide timely updates about everything crypto & blockchain, right from startups to industry majors.
Investment Disclaimer:
All opinions and insights shared represent the author’s own views on current market conditions. Please do your own research before making investment decisions. Neither the writer nor the publication assumes responsibility for your financial choices.
Sponsored and Advertisements:
Sponsored content and affiliate links may appear on our site. Advertisements are marked clearly, and our editorial content remains entirely independent from our ad partners.
Read the Next News


Be the first to comment