


What to know:
- Short positions in SOL are closing as open interest declines while net delta rises.
- Solana price holds near support but shows weak follow-through on rebounds.
- Liquidity clusters at $87–88 remain a strong resistance above the market structure.

Recent data shared by CW shows a clear shift in Solana price dynamics inside futures markets. Open interest is moving lower while net position delta is rising, a pattern that usually signals short positions are being closed.
This suggests traders are exiting bearish exposure rather than building fresh longs. Earlier, the Solana price dropped sharply from around $86 toward $82, triggering heavy liquidations and reducing leverage across the market.
After this move, open interest continued to trend downward, confirming reduced participation. Even during rebounds, the Solana price failed to attract strong new positioning, showing that the recovery is not driven by aggressive accumulation.

Instead, it reflects position unwinding and cautious sentiment. Market structure indicates that buyers are not yet stepping in with conviction, keeping the move fragile.


Source: X
Solana price action shows a weak recovery structure
The Solana price experienced a sharp decline between May 23 and 24, falling from the mid-$86 zone to near $80. After this drop, a bounce pushed the Solana price briefly back toward $82.40, but momentum quickly faded.
The structure shows repeated lower highs, indicating that bulls have not regained full control. Volume spiked during the selloff, showing strong participation, but later activity slowed significantly.
Open interest also declined during this phase, confirming reduced speculative engagement. The Solana price recovery appears more corrective than trend-defining, as follow-through buying remains limited.
Cumulative volume delta data further shows weak demand, with selling pressure still dominant across sessions. Support near $80–81 continues to hold, but repeated tests highlight vulnerability if pressure returns.
Also Read: Solana Price Faces Strong Selling Pressure After Failed Rally Attempt
Liquidity Zones and Market Structure Pressure
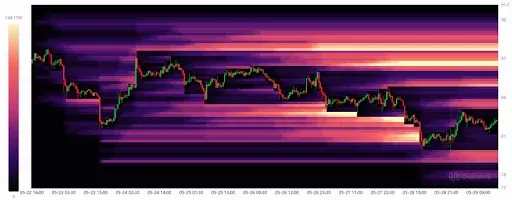
Liquidity analysis shows dense sell-side clusters between $87 and $88, which continue to cap upside moves in the SOL price. These zones act as strong resistance, repeatedly rejecting attempts to push higher.

Source: X
On the downside, liquidity around $80–81 has acted as a short-term support area, preventing deeper breakdowns. However, the imbalance between tested lower liquidity and untouched upper liquidity suggests the market is still in a corrective phase.
The Solana price remains trapped between these key zones, unable to establish a clear breakout direction. Each rebound has failed to reach higher liquidity pools, showing a lack of strength in bullish momentum.
Until these overhead clusters are cleared, the Solana is likely to remain range-bound. A breakout above $88 with rising open interest would be needed to confirm stronger trend continuation.
This article contains market analysis and price predictions. These are not guarantees. Crypto markets are volatile. Always DYOR. Not financial advice.
Also Read: PEPE Price Hints at a Reversal to $0.00000349 as Falling Wedge Pattern Forms



Be the first to comment