


What to know:
- Solana price holds above $90.25 support while struggling near $96 resistance.
- Solana price remains range-bound after rejection at $96 possible ABC correction.
- Technical indicators show mixed momentum, RSI above fifty, and MACD bullish fading.

Solana price is sustaining itself above crucial support zones while maintaining stability amid a brief recovery period. The SOL price remains range-bound inside a corrective pattern, and technical analysts are keenly following to identify any possibilities of a potential breakout from the current consolidation zone.
At the time of writing, SOL is trading at $93.52, showing a 2.44% increase over the last 24 hours. Daily trading volume reached $6.50 billion, while market capitalization stood at $53.54 billion, according to CoinMarketCap.

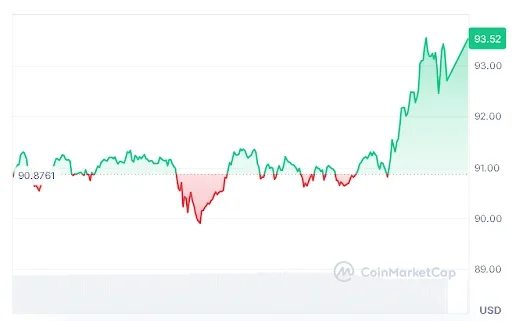
Source: CoinMarketCap

Also Read | Bitcoin Holds Above $80K as US 10Y Yield Reaches 4.4%
Solana Price Stays in Correction Phase
On May 14, 2026, a crypto analyst, More Crypto Online, pointed out that the current Solana price remains within the corrective pullback process and no significant change has been observed in the outlook compared to the previous analysis. The rejection of Solana at the $96 resistance area was anticipated.
The overall structure also indicates that there is still a possibility of an ABC corrective pattern. Nevertheless, the SOL price will require more gains from support to sustain short-term upside momentum.


Source: More Crypto Online’s X Post
Solana price is currently at support near the $90.25 level. For as long as it can remain above that level, there will be a potential for further price increases. The correction in price from its peak on May 12 continues to remain a corrective phase.
But there is still no strong support bounce, indicating that momentum should be improved before confirming the upcoming upward wave.
A fall below the SOL price at $90.25 can pave the way for a further decline to the next significant support level at $81.50, corresponding to those seen in late April.
Technical Signals for Solana Price Show Mixed Strength
Based on the technical analysis of Solana price, it can be observed that buying pressure is present; however, buying momentum is weakening somewhat. The SOL RSI currently stands at 58.15, where its moving average is 58.64. As the RSI stays above 50, buying strength continues to be positive, albeit weaker compared to previous levels.


Source: TradingView
Meanwhile, MACD favors a bullish setup as well. MACD line trades above the signal line, and the histogram remains in positive territory. It implies that the bulls are still in charge, although the decreasing bars on the histogram show that buying pressure is losing steam.
Overall, the SOL price is currently experiencing a recovery trend, but it will depend on whether buyers can hold their ground and muster enough energy to make a new advance.
This article contains market analysis and price predictions. These are not guarantees. Crypto markets are volatile. Always DYOR. Not financial advice.
Also Read | Dogecoin Price Prediction: Breakout Rally Could Extend Toward $0.20 Zone

Be the first to comment