



Solana price continues to remain above its key daily exponential moving averages after an impressive rise in August.
Cooling momentum indicators like the fall in the relative strength index, lower trading volumes, and falling open interest indicate that the market could be entering a consolidation phase.
At the time of writing, Solana price is trading at $102.78, marking a decline of 0.57% in the last 24 hours.
Also Read: Solana Price Holds Support as MoneyGram Boosts Payments Narrative

Solana Price Remains Above Key Daily EMAs
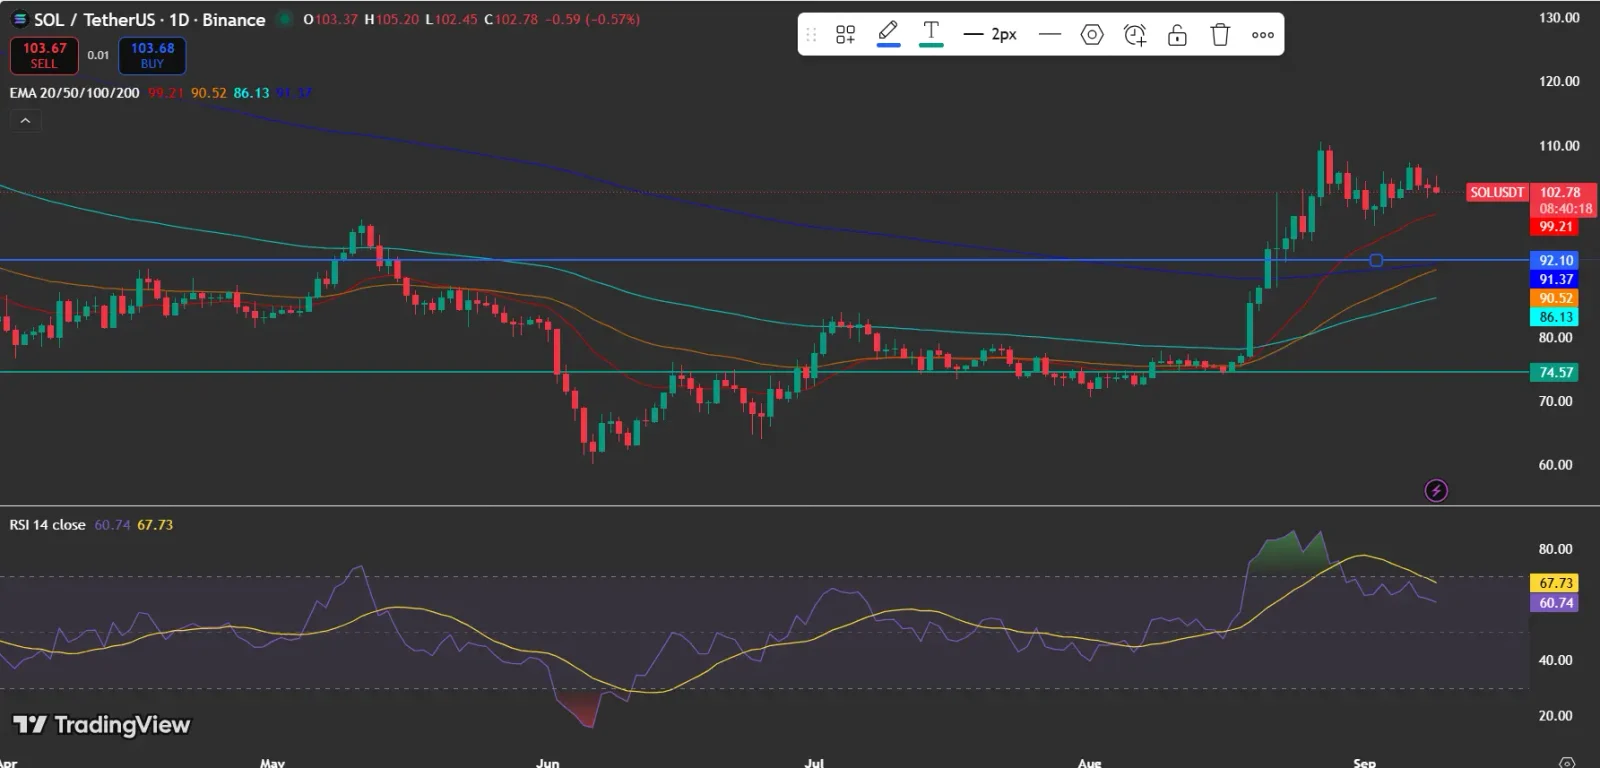
From the daily chart provided by TradingView, we can see that Solana price is trading above all four of its exponential moving averages (EMAs), which include the 20-day, 50-day, 100-day, and 200-day EMAs.
The chart shows that SOL’s 20-day EMA is at $99.21, while the 50-day, 100-day, and 200-day EMAs stand at $90.52, $86.13, and $91.37, respectively.
Such a pattern keeps the broader trend positive for the asset despite the slowdown.In the first place, bulls will need to defend the level at about $99.21.
In case of a deeper retracement, traders will have to pay attention to the level of $92.10, whereas $74.57 is a wider area of support because of the earlier consolidation.
The Solana RSI stands at 60.74, with the RSI average at 67.73, showing that August’s strong momentum has cooled.
However, the reading remains above bearish territory, suggesting that the broader bullish momentum is still intact.
Also Read: Solana Price Eyes $478 as RWA Growth and Network Activity Strengthen
Open Interest Falls After the Solana Rally
According to the data from Coinglass, Open interest has been climbing sharply as Solana price gained strength. At the start of August, open interest was around $4.4-$4.5 billion, but has now climbed to $7.5 billion amid the late-August rally peak, before falling to roughly $6.6 billion.
The price-open interest connection observed is the key to interpreting this information. It seems that the SOL rally has attracted substantial derivatives positioning. Some of that leverage has already been reduced, as shown by the falling open interest and consolidation in the market.
It is unclear from this data which positions remain and whether they are net long or short. Therefore, it would be incorrect to say that the current open interest represents a clearly bullish or bearish positioning bias.
Also Read: Solana Cat Memecoin ZCAT Pays Nearly $3 Million in Zcash Rewards
Importance of Solana Liquidations
The liquidations graph provides one more dimension of the August move. Most notably, the largest liquidation spike in the chart took place around August 20 due to the spike in short liquidations, which reached roughly the $100 million mark shown in the graph. This was accompanied by SOL’s fast move away from the $70s range.
The significance of this observation lies in the fact that at least part of the upmove may have been supported by the forced closure of short positions. When short positions are liquidated, they are closed through forced buying, which can potentially add further upward pressure to an existing price move.
This does not mean that liquidations alone caused the rally, but their timing alongside Solana price sharp move higher shows that leverage played an important role during the breakout.
Moreover, the graph shows that there were liquidations even after the breakout, with both long and short liquidations appearing at different points as SOL became more volatile.
Also Read: Solana Price Targets $110 as Bulls Test Key Resistance Zone
Solana Trading Volume Cools After the August Breakout
Solana’s trading volume suggests that the August breakout was very different from the previous period of low activity.
According to CoinGlass data, daily volume spiked significantly during the rally, with multiple days reaching about $12 billion to $15 billion and the peak being close to $17 billion. Prior to the breakout, daily volume usually used to be much smaller.
The recent trading volume has fallen quite noticeably from those levels, although the SOL price is still holding around $100-$105. This is a critical moment to test the future direction.
Should SOL go higher but volume also increase, this will provide more confidence in new demand coming into the market. On the other hand, if the price rises without a meaningful recovery in volume, the move would have less confirmation from trading activity.
Solana Foundation Brings Institutional Focus
The X update by Solana Foundation announces Solana & Suits, which is a closed, invitation-only forum scheduled to take place on October 5 in London.
The forum focuses on the future of capital markets and will host speakers from Standard Chartered, State Street, Société Générale, Baillie Gifford and Allfunds.
The post asks:
“What will the world’s financial system look like in ten years?”
It further describes the event as:
“Not a debate about whether change is coming, but how it gets built.”
The importance of the event does not come in the form of an immediate price catalyst, but rather as a source that helps in identifying the target audience for Solana.
By bringing banks, asset management firms and others into the discussion regarding onchain financial infrastructure, it offers a broader fundamental rationale behind the SOL narrative, although there is no evidence from the available data that directly links the event announcement to the recent price movement.
Can Solana Price Break Above $110?
The current technical setup offers investors a number of close levels for analysis. To the upside, there is the $105.20 intraday high as the primary short-term resistance level, while the $110 region marks another short-term resistance level at which Solana price faced selling interest.
A clear break above this level, combined with increasing volumes, would be a sign that the rally from August is picking up pace again.
To the downside, there is the $99.21 level, which corresponds to the 20-day EMA, and this would be the first significant level to defend.
Breaking below this level will weaken the near-term momentum, while a breakdown below $92.10 will give rise to a deeper technical correction and bring the wider $74.57 support area into focus.
Also Read: Offchain Labs Faces Solana Clash Over Robinhood Chain Fee Model
This article contains market analysis and price predictions. These are not guarantees. Crypto markets are volatile. Always DYOR. Not financial advice.



Be the first to comment