



Solana price is showing signs of recovery as buyers defend a key support area and analysts watch for a move toward the next resistance level. The recovery is supported by stronger market participation, rising demand for Solana-based investment products, and growing stablecoin liquidity on the network.
These developments provide a broader backdrop for SOL, although continued price strength will depend on whether buyers can maintain the current support and sustain momentum.
Solana Price Holds Above $117 as Analyst Eyes $143
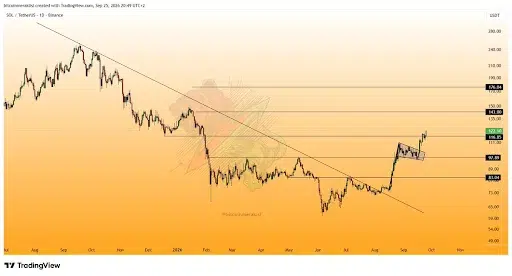
Analyst Bitcoin Meraklisi’s latest analysis identifies $117 as a key support level for Solana after SOL reached the area and saw a minor correction. The analyst expects another upward move if buyers remain in control, with $143 identified as the next target.
SOL closed at approximately $120.81 on September 25 after reaching $122.07 during the session, moving back above the $117.04 close recorded on September 24.

Source: Analyst Bitcoin Meraklisi X post
The recovery has also lifted SOL significantly from its September 16 low near $96.87. At $120.81, the token was roughly 24% above that monthly low.
Holding above $117 would keep the current recovery structure intact, while a sustained move higher could bring the $143 level into focus. Conversely, losing the $117 area could weaken the setup and shift attention toward lower support levels.
Also Read: Solana Price Eyes $500 After Bullish Breakout as Network Activity Accelerates
Solana Stablecoin Supply and ETF Inflows Show Rising Demand
The price recovery is occurring alongside a major increase in stablecoin liquidity on the Solana network.
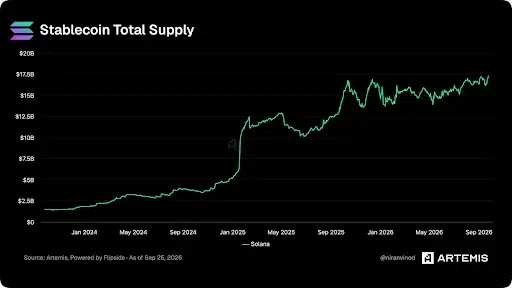
Solana’s official account reported that Solana’s stablecoin supply has reached a new all-time high of $17.3 billion, adding to signs of increased liquidity across the network.
Source: Solana
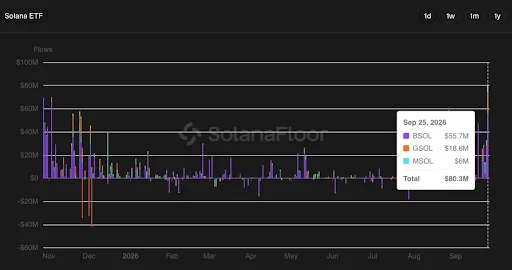
According to SolanaFloor’s figures, at the same time, U.S. spot Solana ETFs recorded $80 million in net inflows in the latest session, marking their largest single-day inflow on record. Weekly net inflows have now reached $181 million, the second-highest weekly total recorded.
Source: SolanaFloor
The two indicators reflect different parts of the Solana market. Stablecoin supply measures the amount of dollar-pegged liquidity held on the network, while ETF inflows track demand through regulated investment products. Together, they provide additional context for SOL’s recent recovery, although neither metric alone confirms future price direction.
What happens next?
The immediate technical focus remains on whether Solana price can maintain the recovery above the $117 support level.
If buyers continue defending that area, the $143 resistance identified by Bitcoin Meraklisi becomes the next major level to monitor. A break toward that zone would extend SOL’s recovery from its September low, while renewed weakness below support would challenge the current setup.
Beyond price action, ETF flows and the record stablecoin supply provide important indicators of market participation around Solana. The network now has more dollar-denominated liquidity available across its ecosystem, while regulated investment products are attracting fresh capital.
For SOL, the next phase will therefore depend on whether the token can build on its recent recovery while network liquidity and market participation remain elevated.
Also Read: Solana Flip Ethereum 2026: Explosive Bullish Flip Ahead?
This article contains market analysis and price predictions. These are not guarantees. Crypto markets are volatile. Always DYOR. Not financial advice.


Be the first to comment