


What to know:
- Solana (SOL) is holding key support near $86 after a mild 2.9% daily decline, with analysts viewing the move as a healthy correction.
- Price consolidation between $86–$87 keeps bulls focused on a potential upside target around $93–$95 if support holds.
- Technical indicators show neutral-to-bullish momentum, with RSI near 55 and MACD signaling strengthening upward pressure.

Solana (SOL) is trading around an important support point after experiencing a slight decline, according to market experts who described it as a healthy correction, not a weakness in the cryptocurrency. The current performance has become interesting for investors, observing how stable SOL will remain and move forward.
At the time of writing, SOL is trading at $86.79, recording a 2.90% drop over the last 24 hours, with daily trading volume reaching $6.42 billion and a market capitalization of $49.91 billion, according to CoinMarketCap. The crypto market remains steady, with investors closely watching key support zones for continuation signals.


Source: CoinMarketCap

Also Read | Circle Launches USDC Bridge via CCTP, Streamlining Cross-Chain Transfers
Solana Holds Support Amid Bullish Outlook
On April 18, 2026, a crypto analyst, BitGuru, published an upbeat prediction about Solana’s existing structure on X, which is formerly known as Twitter. As per this crypto analyst, the recent price action is indicative of good rest, not any form of weakness.
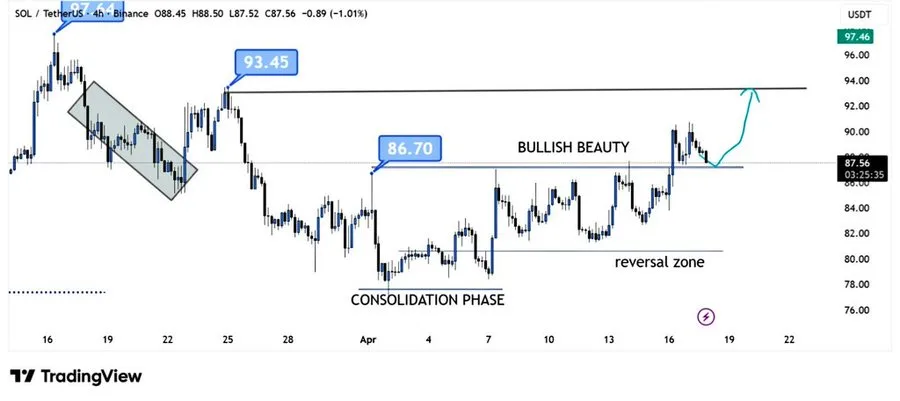

Source: BitGuru’s X Post
Following a consolidation phase and an upturn from its lower levels, the price of SOL has stabilized at around $86-$87. Provided that this support level holds firm, the next rise could see prices move up towards the $93-$95 level.
Technical Indicators Suggest Gradual Strength
From a technical perspective, there is some upward pressure in Solana. The Relative Strength Index (RSI) level is at 54.93 currently, which means that the market is neutral, but has a slight uptrend. This is indicated by the fact that the RSI is staying above 50.

Source: TradingView
However, the moving averages have become supportive in the short term. As per the Moving Average Ribbon, the important levels are seen at $84.89, $85.72, and $83.63, which help in supporting the price movement. But the main obstacle is the 200-day moving average at $96.44.
The momentum indicators have also become bullish. The MACD indicator has moved above its signal line, where the MACD is at 1.13, while the signal line stands at 0.79. The histogram has switched to green, indicating that there is increasing pressure for an up move, but the speed is moderate.
Solana Steady As Upside Momentum Builds
Overall, it seems that Solana is at a stable point with potential for slow improvements. The current retracement doesn’t point to any serious downside threat, although a break through key resistances would be required to validate further bullish action. For the time being, staying above the $86 region should prove crucial for continued upside moves.
This article contains market analysis and price predictions. These are not guarantees. Crypto markets are volatile. Always DYOR. Not financial advice.
Also Read | Arbitrum (ARB) Eyes $0.46 After Explosive Breakout Above Descending Channel

Be the first to comment