


What to know:
- Solana rises 4% toward $89.89 as bullish momentum strengthens the market.
- RSI and MACD indicators both show improving short-term bullish momentum conditions.
- Key support near $78–$82, while a $90 breakout could trigger upside continuation.

Solana continues to exhibit early indications of a slow recovery following its volatile movements, as the price begins to stabilize around a crucial technical resistance area while the momentum indicators become increasingly bullish.
At press time, Solana is trading at $89.20, supported by a 24-hour trading volume of approximately $10.66 billion and a market capitalization of $51.71 billion, according to CoinMarketCap. Over the last 24 hours, SOL has gained about 4.01%, reflecting renewed buying interest following recent pullbacks across the broader crypto market.
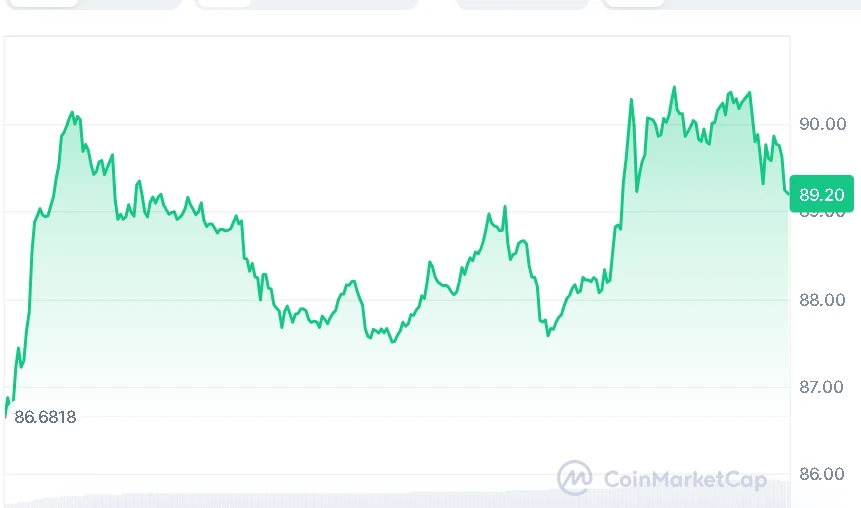

Source: CoinMarketCap

Also Read | CEX Trading Plunges 39% in Q1 as CoinGecko Warns of Brutal Crypto Winter
Solana Consolidates Near Key Resistance Zone
The crypto analyst, More Crypto Online, made an observation about the technical analysis for Solana, where he pointed out that there were two legitimate setups that would depend on the market price.

Source: More Crypto Online’s X Post
An important area of support persists within the range of $78.77 to $81.65. The return of SOL to this range will maintain its present bullish trend in the white scenario. On the other hand, an increase in price movement from its current position will validate the orange scenario.
The initial resistance level is positioned at the $90 area. The price breaking above this level would enhance the chance of upward movement and bring attention to more liquid areas. As long as this level remains under control, the two possible options remain valid.
Momentum and Indicator Signals Improve
Early signs of technical strength are seen in some of the technical indicators in the short-term movement. The current value of the RSI indicator stands at 58.02. This is above the signal level of 48.92, showing positive buying interest, though still within range.

Source: TradingView
The SOL is also trading above the short-term moving average ribbon at $83.35 to $85.82, implying that a period of recovery is currently occurring. Yet, despite the recovery period that is occurring, the price is still below the long-term moving averages at $96.86 and $127.60.
However, the Moving Average Convergence Divergence (MACD) indicator is showing positive readings. The MACD line, which currently stands at 0.94, has risen above the signal line, which is currently at around 0.33. Meanwhile, the histogram is now showing green bars, indicating that momentum is expanding.
Solana Recovery Hinges on Resistance Break
Overall, Solana is beginning to give indications of recovery that have been fueled by improved momentum, with prices stabilizing above some short-term technical indicators. Nonetheless, the market finds itself at a crucial juncture where a breakout above the $90 level or a break below lower levels will determine future trends.
This article contains market analysis and price predictions. These are not guarantees. Crypto markets are volatile. Always DYOR. Not financial advice.
Also Read | Grinex Suspends Operations After $13 Million Hack Triggers Security Concerns

Be the first to comment