


What to know:
- SOL price gains hold as volume jumps sharply, signaling stronger market participation.
- Resistance builds between $85.50 and $89.75 as repeated rejections limit upside.
- Ascending channel holds structure with $108 resistance and $49 support intact.

Solana (SOL) price maintained an upward trend during the latest session as market sentiment improved, as of April 14, 2026. The asset continued to show strength on the weekly time frame. Trading activity also increased, signaling stronger participation from market participants.
As of writing, Solana (SOL) price is trading at $85.90, marking a 4.93% increase in a day. The trading volume is showing a strong bullish surge up 66.1% and is currently standing at $5.74 billion. Over the last week, the SOL coin price has gone up by 8.16%, according to CoinMarketCap.
Also Read: Solana (SOL) Price Stabilizes Above $80 as Bulls Defend Key Support Zone

SOL Price Struggles as Selling Pressure Persists
Crypto analyst MCO Global pointed out a micro-resistance around $85.50, and the price has been tested several times. Multiple rejections at this level indicate that short-term selling pressure is still very active. This level is still acting as an immediate resistance to further upward movement.
Next resistance is between $87.87 and $89.75. This area corresponds with recent price accumulation and levels of technical resistance. A sustained break and hold above here would further bolster this bullish structure, allowing for further upside.


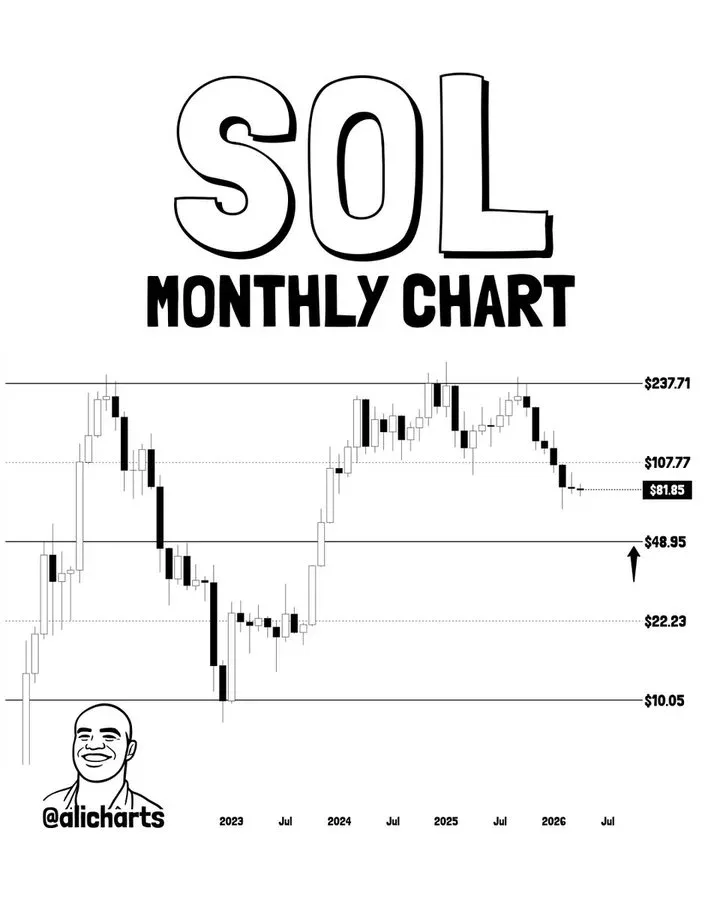
Moreover, another analyst, Ali Martinez, mentioned that the broader structure remains an ascending channel on higher timeframes. Price continues to respect the channel boundaries, with higher lows forming within the range. This structure defines the current long-term trend direction.
He identified $108 as the key macro resistance level where price has faced repeated rejection. A move above this level is required to confirm stronger upside continuation. He also marked $49 as major support, positioned near the mid-range of the channel.

Volume and Open Interest Rise
According to CoinGlass data, there has been a 66.83% increase in future volume to $13.35 billion. Open interest has also gone up by 9.07% to $5.21 billion. The OI-weighted funding rate is recorded at 0.0081%.
SOL Price Holds Range as EMA Pressure Caps Upside
From a technical perspective, SOL price is trading below the key exponential moving averages on the daily chart. A near-term resistance is at $87.53, the 20-day EMA. At press time, the price was trading just below this level, which would prevent attempts to rise higher in the near future.
The 50-day EMA is at $87.23, sitting close to the 20-day EMA. This forms a compressed resistance cluster just above in the $87 zone. However, price has not yet made a sustained close above this zone in the past few sessions.
There are additional resistance levels here as suggested by the higher timeframe EMAs. The 100-day EMA is located at $98.75, above the spot price. The 200-day EMA at $119.23, which can be seen as a longer-term resistance line on the chart.
Bollinger Bands show a defined trading range. The upper band is at $87.23, while the middle band sits at $82.88. The lower band stands at $78.52. This shows that price is hovering around the upper boundary, implying a lack of increase in volatility.
This article contains market analysis and price predictions. These are not guarantees. Crypto markets are volatile. Always DYOR. Not financial advice.
Also Read: XRP at $1.34: Whale Accumulation Sparks Optimism for a Potential Breakout

Be the first to comment