




TLDR
- Solana traded near $106 on Oct. 15 after testing $100 support, with a low of $100.62.
- U.S. spot SOL ETFs saw $1.29 million in outflows on Oct. 14, their eighth straight day of withdrawals.
- Daily MACD stayed negative, and the 200-day EMA at $97.95 is the first major support.
- Tokenized equity supply on Solana rose to nearly $611 million across 1.42 million holders.
- Analyst Don Wedge flagged an $80 to $95 support zone, while analyst Aman set $97 to $99 as key support.
Solana (SOL) fell to the $100 level this week before bouncing back above $106. The token hit an intraday low of $100.62 on Oct. 15 and closed the session up 1.84%, according to TradingView data.
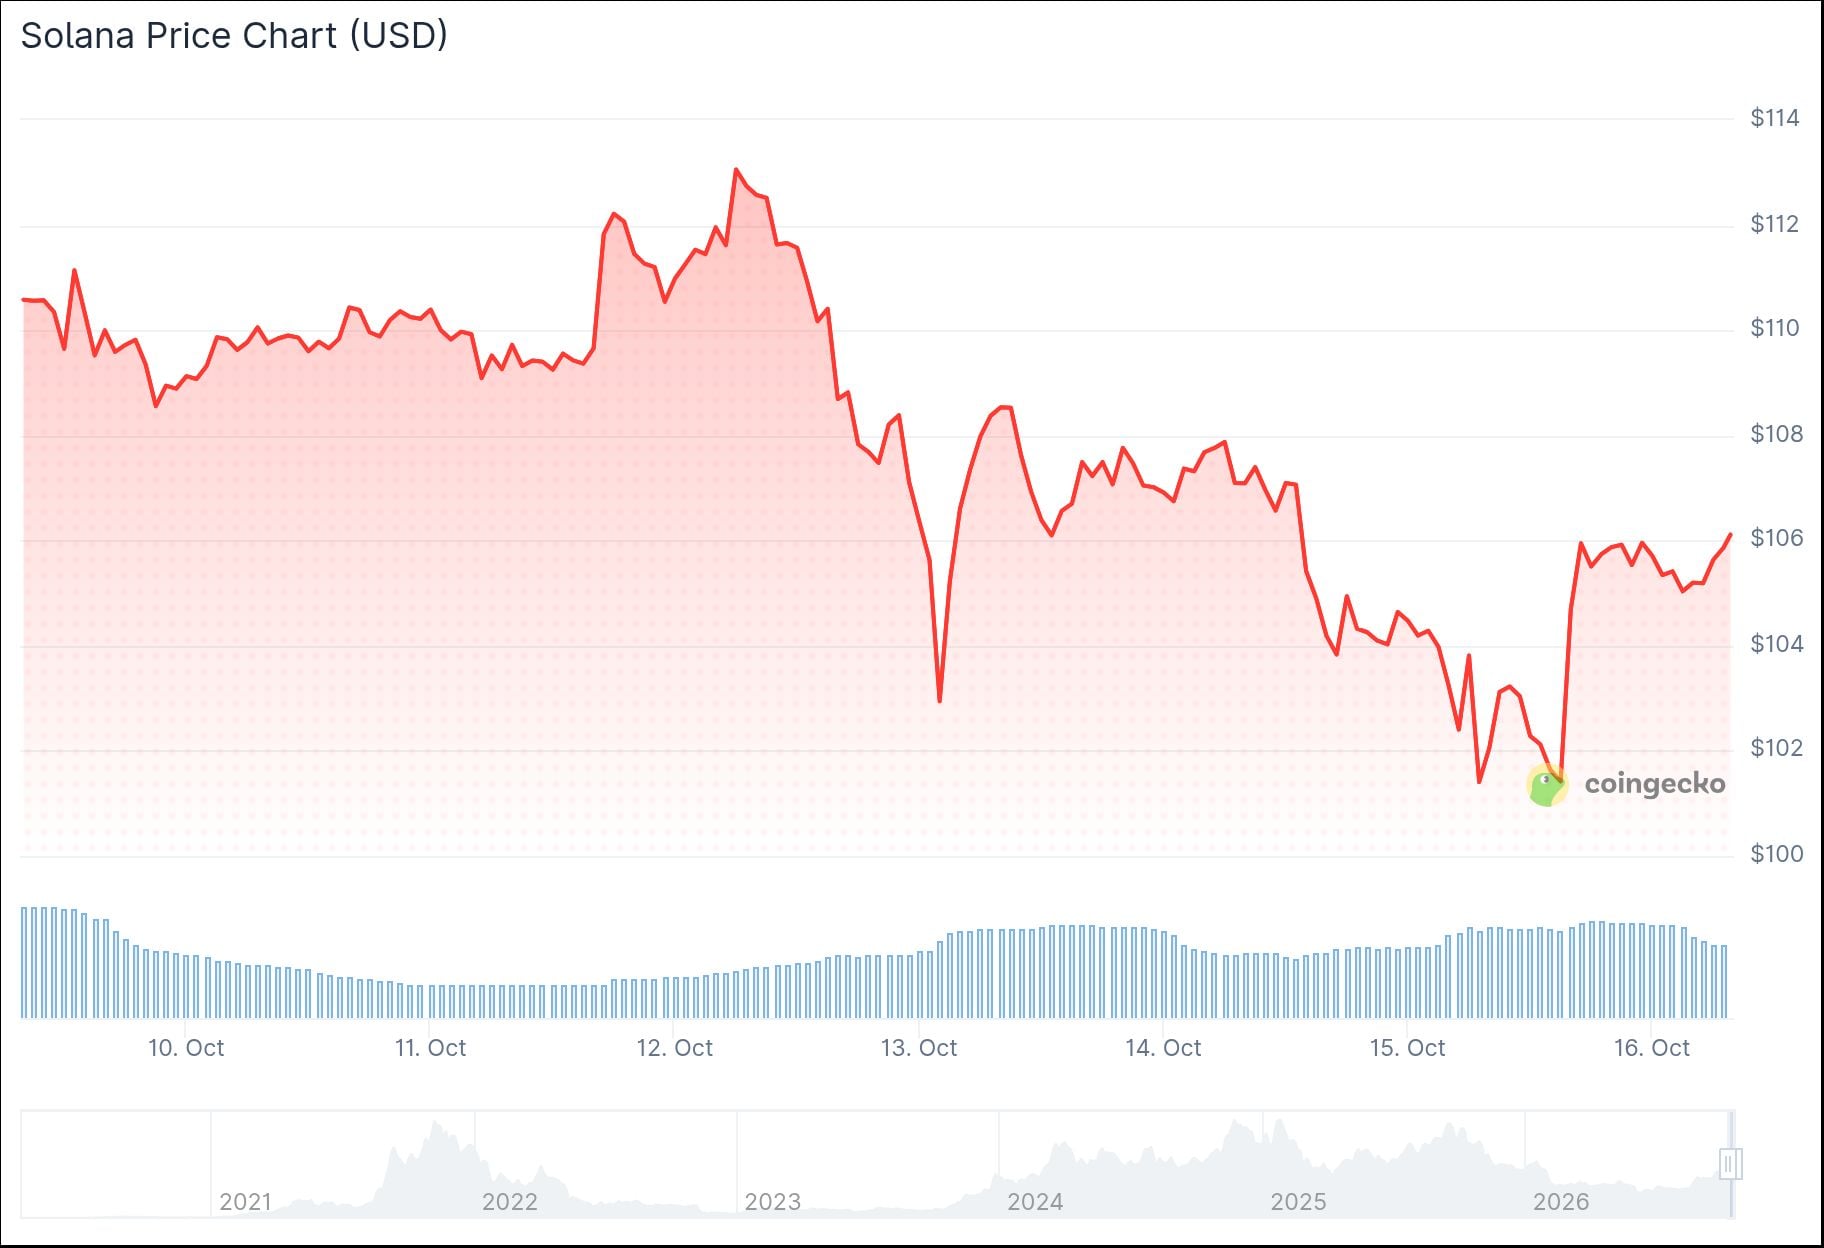
SOL is still down more than 13% in October. It sits roughly 14% below its late-September peak near $124.
Demand from investment funds remains weak. SoSoValue data shows SOL-focused ETFs recorded $1.29 million in net outflows on Oct. 14. That marked the eighth day in a row of withdrawals, following $24.81 million in outflows the week before.
$SOL — Wed: US spot Solana ETFs −$1.3M (BSOL took 100% of the print).
8th straight outflow day — streak running since Oct 5.
Spot ~$102, knocking on $100 after ≈−13% in October.
Why it matters: the ETF wrapper is still risk-off while the $100 magnet gets louder —… pic.twitter.com/OwiLQtBLbS
— Rich Peter (@RichPeterLi) October 15, 2026
Not all Solana data points lower. Blockworks figures show tokenized equity supply on the network rose to nearly $611 million on Tuesday. That supply is spread across 1.42 million holders.
Technical Picture
The daily chart shows a bearish tilt. The MACD line sits at −1.07, below its signal line at 0.95, and the histogram reads −2.03. The Relative Strength Index is near 35.
SOL trades below the 50-day EMA at $107.13 after a double-top reversal from $122 in early October. It remains above the 200-day EMA at $97.95, which FXStreet describes as a corrective phase within a broader uptrend.

On the daily Bollinger Bands, the lower boundary is at $102.83 and the middle band is at $114.95. At $106.21, the token sits about 7.6% below the middle band.
The 4-hour chart shows SOL just above its 20-period average at $106.11. Three averages sit overhead at $109.21, $112.67 and $114.43.
Analyst Don Wedge said on X that SOL was rejected at a dashed trendline and fell 8% this week to $102. He pointed to a green support zone between $80 and $95 that has held every test since 2021. He said a retest and hold would keep his setup valid, with targets of $166 and then $378, while a loss of the zone would invalidate it.
$SOL → rejected at the dashed trendline, −8% this week to $102
next support → the green zone at $80 to $95, held every test since 2021
retest and hold → setup still valid, $166 then $378
lose the zone → bullish setup invalidatedzone retest incoming, watching it pic.twitter.com/4DdWlie0AG
— Don 🐂 (@DonWedge) October 15, 2026
Analyst Aman separately named $97 to $99 as a support zone after SOL broke an ascending trendline. He said the area needs to hold to prevent more losses. If it fails, he sees $75 to $77 as a possible downside zone.
CoinGlass data shows liquidation clusters near $100 to $101 below the price. Further clusters appear near $96 to $97, close to Aman’s support area.
Chart Analysis
The daily chart shows lower highs and lower lows since SOL lost its early-October range of $118 to $122. The rebound from $100 came without a bullish MACD crossover, and the 4-hour Chaikin Money Flow sits at −0.02, just below zero.
The level to watch next is $109.21, the 50-period moving average on the 4-hour chart. A move above it would put $112.67 to $114.95 in view. A drop below $100 would bring $97 to $99 into focus.


Be the first to comment