



Solana has reached another major milestone, not in price but in blockchain usage. Weekly transaction activity has climbed to a new all-time high, with the network processing more than 1.01 billion non-vote transactions during the week ending August 2.
The figure marks the strongest level of activity in Solana’s history and underscores the network’s growing role as one of the most heavily utilized blockchains in the cryptocurrency industry.
Transaction count surges
The surge has been building for months. Throughout 2025, transaction counts have consistently trended higher, regularly exceeding 800 million per week before finally crossing the one-billion mark.

Unlike previous spikes driven primarily by memecoin speculation, the current increase appears more sustained, reflecting activity across decentralized finance, stablecoin transfers, token launches and a growing ecosystem of consumer applications.
The milestone also highlights Solana’s technical strengths. High throughput, low transaction fees and fast finality continue attracting developers and users who require inexpensive on-chain execution. As more decentralized applications launch on the network, baseline transaction demand has increased rather than fading after short-term speculative cycles.
Network activity stays up
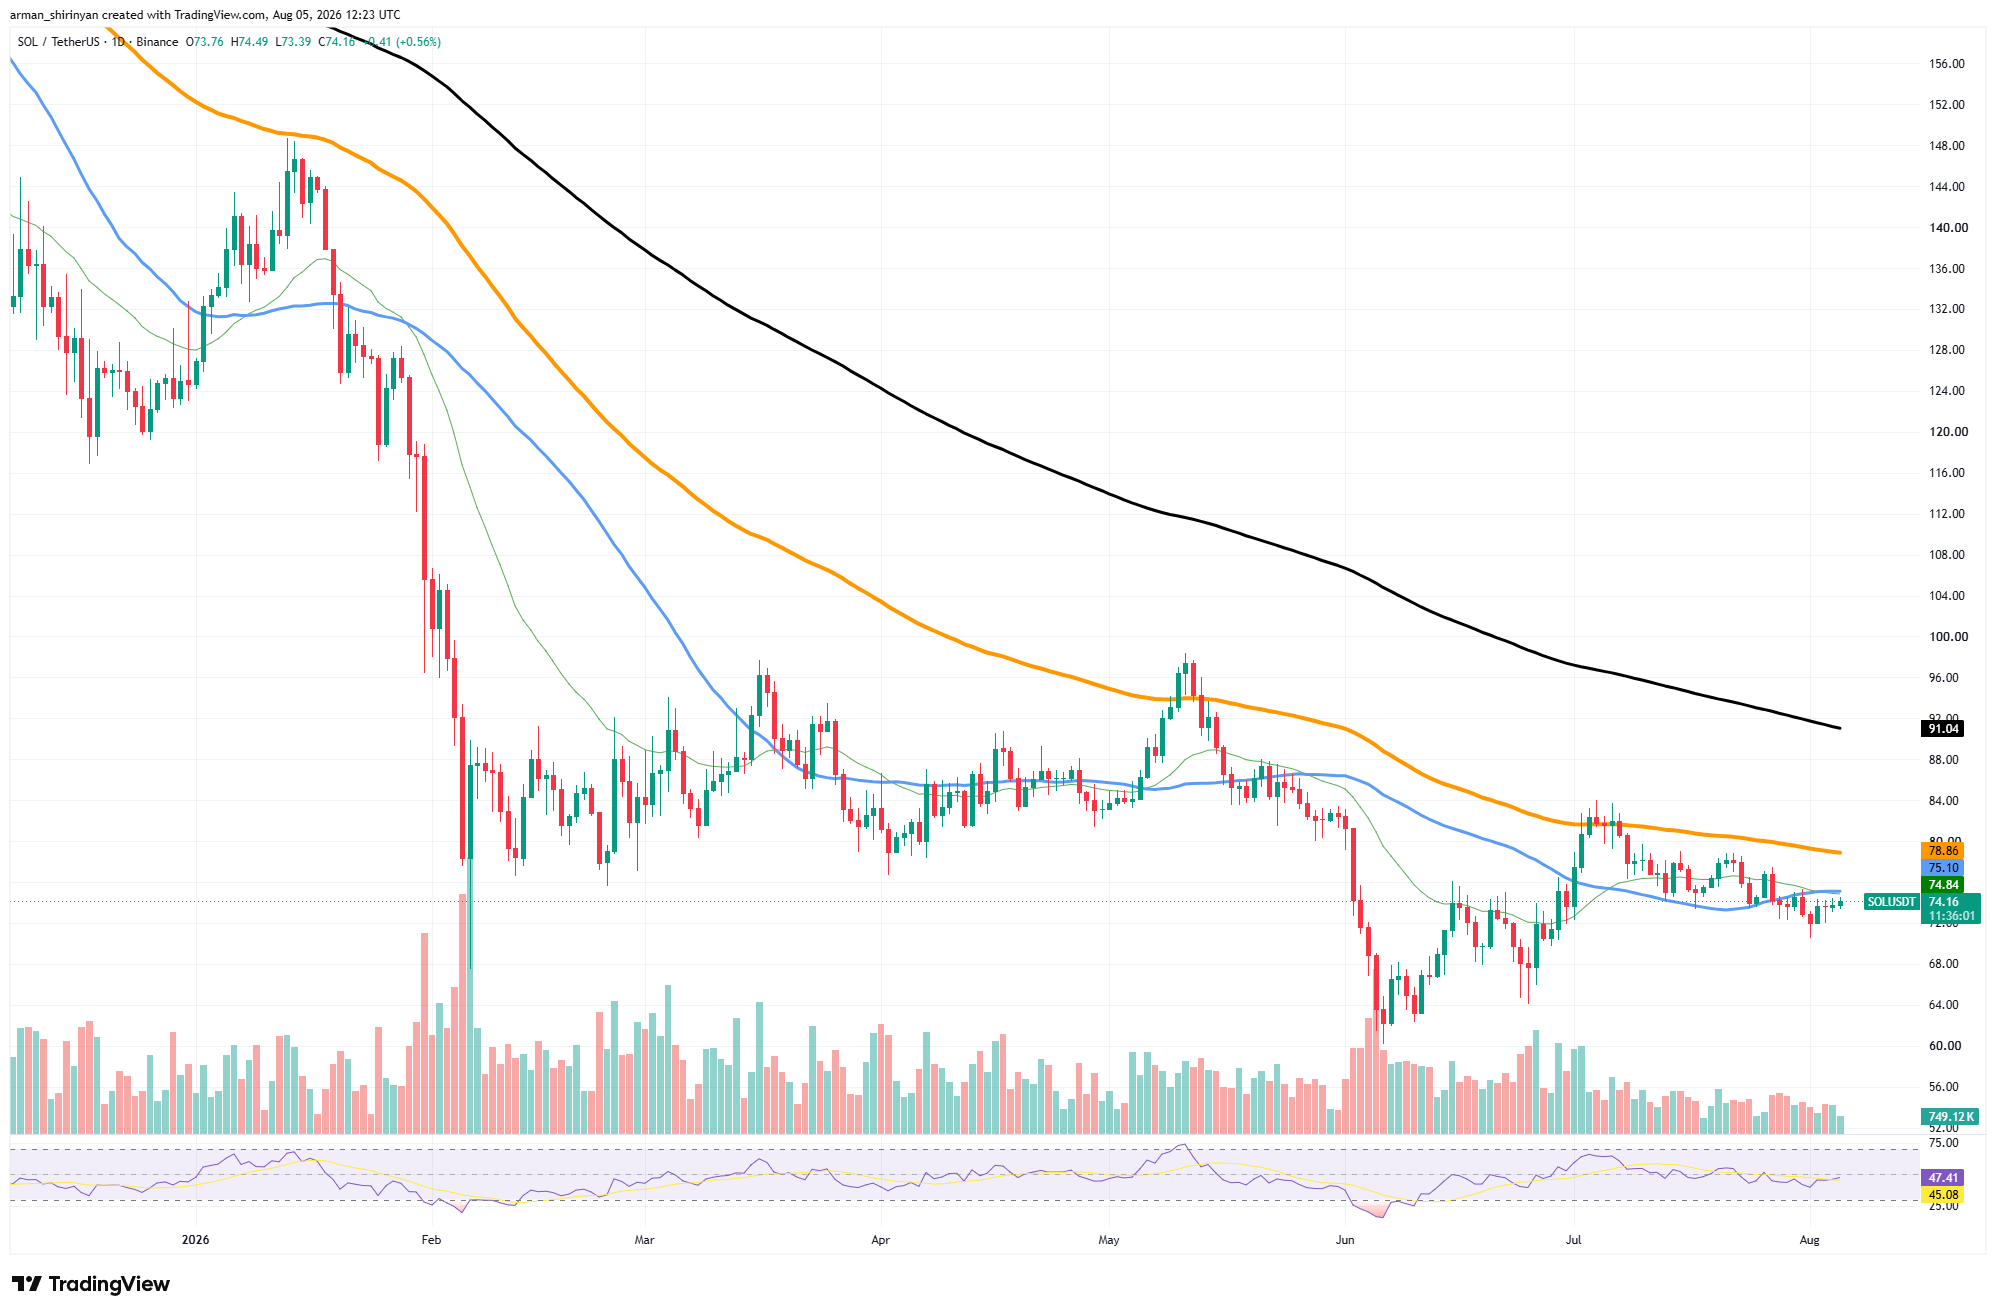
Interestingly, the record-breaking network activity has yet to translate into an equally strong price recovery. SOL is currently trading near $74, well below its major moving averages despite stabilizing after June’s sell-off. The asset remains under pressure from the descending 50-day EMA around $79 and the 100-day EMA near $75, while the long-term 200-day EMA sits substantially higher around $91.
You Might Also Like
The chart reflects a market searching for direction. After rebounding sharply from June lows below $65, Solana has entered a prolonged sideways range between roughly $72 and $76. The 50-day and 100-day moving averages have begun converging around the current price, suggesting a decisive move may be approaching.
Momentum indicators remain neutral. The Relative Strength Index is hovering near 46, showing neither buyers nor sellers have established a meaningful advantage. Trading volume has also declined during the consolidation, indicating market participants are waiting for a stronger catalyst before committing to a new trend.
The disconnect between network fundamentals and price action is becoming increasingly noticeable. Solana is processing more transactions than ever before, yet its token continues trading below key technical resistance.


Be the first to comment