



SOL has a market cap of $58.62 billion, as on date, and crypto market cap is at $2.61 trillion:
- Solana ETFs Record $925K in Daily Inflows as New Month Opens.
- 5.2 Billion Non-Vote Transactions in August: Solana Achieves New ATH.
- Robinhood Blockchain Volume Hits Record $1.3 Billion as Meme Coin Trading Surges.
- DeFi Development Corp Proposes $20 Million Preferred Stock Offering to Buy More SOL.
- OpenSea Restores Solana NFT Trading on OS2.
- Solana Cuts Mainnet Slot Time to 350 Milliseconds.
On the daily chart, Solana (SOL) is currently trading around $100.30. SOL took support from its rising trendline and broke above the key resistance level of $99.80, triggering a strong rally toward the $110 level. SOL outperformed several other major crypto assets during the move, supported by strong ETF inflows and a positive response from investors.
However, after such a strong rally, the market may pause or consolidate before making its next directional move. If SOL sustains above the $101 level, it could attract fresh buying interest in the coming days and potentially resume its upward momentum. Overall, the outlook remains positive, with $101 acting as an important near-term level. A sustained hold above $101 could strengthen the bullish setup, while failure to hold this level may lead to short-term profit booking or consolidation.
Technical Chart of SOL
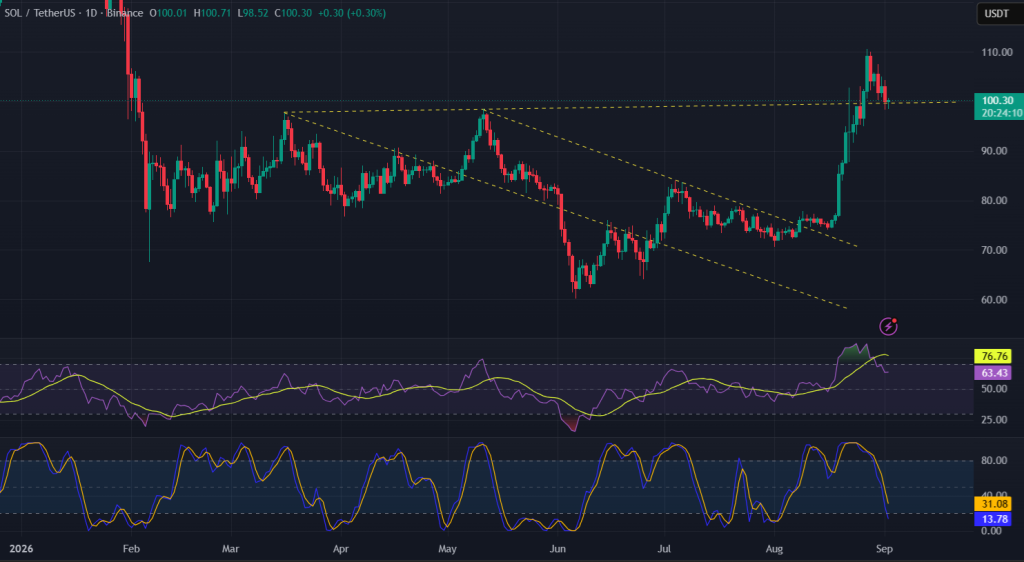
On the Daily Chart, SOL price is trading above its Simple Moving Average (14 & 21 periods) levels of $91.80 & $87.89, indicating support for the price. On the daily chart, the RSI is at 63.43, cooling down from the previous level of 85, while the price continues to hold at higher levels. This indicates that the earlier bullish momentum has moderated, with the price action suggesting accumulation and consolidation at higher levels.

The Stochastic Oscillator is at 13.78, placing it in the oversold zone and indicating that selling pressure may have become stretched. This could support a period of consolidation or a potential short-term recovery before the next directional move. Overall, the broader momentum remains bullish, but traders should remain cautious as the RSI has cooled significantly. A sustained decline below the 70 level would be an early indication of weakening bullish momentum, while a recovery in RSI along with positive price action could signal renewed buying interest.
Also Read: Chelsea FC and Circle Join Forces to Bring USDC to Football
Support and Resistance Levels
| Support 2 | Support 1 | Asset (Price) | Resistance 1 | Resistance 2 |
| $91.10 | $83.71 | SOL ($100.30) | $111.30 | $119.60 |
Above $119.60, there’s a possibility of hitting the $128.20 level.
In the grand scheme of things, ZebPay blogs are here to provide you with crypto wisdom. Get started today and join 6 million+ registered users to explore endless features on ZebPay!
Disclaimer:
Crypto products and NFTs are unregulated and can be highly risky. There may be no regulatory recourse for any loss from such transactions. Each investor must do his/her own research or seek independent advice if necessary before initiating any transactions in crypto products and NFTs. The views, thoughts, and opinions expressed in the article belong solely to the author, and not to ZebPay or the author’s employer or other groups or individuals. ZebPay shall not be held liable for any acts or omissions, or losses incurred by the investors. ZebPay has not received any compensation in cash or kind for the above article and the article is provided “as is”, with no guarantee of completeness, accuracy, timeliness or of the results obtained from the use of this information.



Be the first to comment