



The S&P 500 has powered through an extended run, but holiday periods often reset momentum as liquidity thins, options positioning shifts, and macro catalysts return to center stage. The question now: can an eight-week rally survive the next round of oil moves, rate swings, and inflation reports?
Rather than predicting a single outcome, this guide lays out the playbook: what to watch in crude markets, how yields and term premium ripple through equity valuations, and which inflation components really move risk. You will also find a practical checklist for the post-holiday tape and a scenario map to calibrate exposure without chasing noise.
This is not financial advice. Markets are volatile, macro data can surprise, and correlations change. Use these frameworks to stress-test your plan and size risk appropriately.

| Point | Details |
|---|---|
| Holiday liquidity reset | Volumes often dip around holidays; the following sessions can see rebalancing, gap risk, and faster moves on modest flows. |
| Oil as a swing factor | Crude impacts headline inflation and margins; equities typically prefer stable oil over fast spikes or collapses. |
| Rates dominate multiples | Shifts in real yields and the 10-year Treasury often dictate equity valuations more than near-term earnings beats. |
| Inflation data gauntlet | CPI, PPI, and PCE (especially services ex-housing) can reprice Fed paths within hours, moving risk across assets. |
| Playbook over prediction | Define scenarios, hedge asymmetrically, track breadth/positioning, and avoid leverage creep after strong runs. |
Why holiday liquidity can reset an extended rally
Long rallies breed confidence—until liquidity thins and order books do not absorb shocks as usual. Around holidays, even small surprises in oil, rates, or data can punch above their weight.
Three dynamics matter:
- Flow vacuum: Fewer participants means wider spreads and larger price impact per trade. Stops are more likely to trigger.
- Systematic rebalancing: Target-vol and risk-parity funds may reduce exposure if volatility picks up, amplifying moves.
- Corporate activity: Buybacks sometimes slow during earnings blackout windows; when repurchases pause, dips can deepen.
Post-holiday, watch the first 60–90 minutes for directional intent. If early weakness meets firm dip-buying with improving breadth, momentum can resume. If weakness coincides with rising yields and soft internals, assume a more defensive stance.
Pro tip: Compare equal-weight vs cap-weight S&P 500 performance. If leadership narrows into megacaps while the average stock lags, rallies grow fragile.
Oil at the center: margin math and inflation optics
Crude is the macro variable that touches both the earnings line and the inflation narrative. Energy spikes can lift headline CPI and squeeze transportation, chemical, and consumer discretionary margins. Conversely, collapsing oil can flag growth concerns and pressure energy equities.
What to track in crude markets
- OPEC+ signals: Production targets and quota compliance can tighten or loosen balances. Watch official communiqués and meeting outcomes.
- U.S. inventory trends: Weekly EIA petroleum status reports offer clues on demand, refinery runs, and stock draws/adds (EIA).
- Geopolitics and shipping lanes: Disruptions in key straits or pipeline outages can drive risk premia.
- Refining spreads: Crack spreads affect gasoline/diesel prices and downstream margins more than crude alone.
Equity sensitivity to oil
- Winners: Integrated energy, upstream producers, select midstream firms when price stability coincides with steady volumes.
- Mixed: Industrials and materials—benefit from activity but suffer when fuel and feedstock costs surge.
- Losers on spikes: Airlines, autos, delivery-heavy e-commerce, and consumer discretionary without pricing power.
From a macro lens, equities tend to tolerate gradually rising oil if it reflects healthy demand, but they struggle with rapid spikes that stoke inflation expectations and tighten financial conditions.
Pro tip: Track retail gasoline and diesel trends. Persistent pump-price increases can quickly reshape consumer-sentiment data and discretionary spending.
Rates still call the tune: yields, term premium, and equities
Valuations hinge on discount rates. When the 10-year Treasury yield or real yields move abruptly, price-to-earnings multiples typically adjust faster than earnings estimates. Fed guidance and market-implied policy paths then set the tone for risk appetite.
Which rates matter
- 2-year Treasury: Tracks policy expectations; sensitive to inflation surprises.
- 10-year Treasury: Anchors discount rates for equities, housing, and corporate borrowing.
- Real yields (TIPS): A cleaner measure of growth-adjusted returns; often inversely related to megacap growth valuations.
- Financial conditions: A composite of rates, credit spreads, and the dollar; looser conditions support higher-risk assets.
| Rate backdrop | Equity implication |
|---|---|
| Stable-to-lower long-end yields, easing real rates | Supports duration-sensitive growth, compresses equity risk premium less; rally more likely to persist. |
| Sharp rise in 10-year or real yields | Pressures valuations, hits long-duration tech, narrows breadth; drawdowns can accelerate. |
| Steepening from higher long rates (term premium up) | Mixed: helps banks but undermines broad multiples; factor rotations dominate. |
| Front-end repricing to fewer cuts/more hikes | Rates-sensitive sectors wobble; defensive tilt and quality balance sheets preferred. |
Keep an eye on Fed communications and the Summary of Economic Projections when in cycle. Market probabilities can whipsaw within hours after a hot or cool inflation print, and equities often echo that repricing.
Risk note: Auctions and refunding announcements can move yields independently of data. Heavy duration supply sometimes lifts term premia and tightens conditions.
Inflation data gauntlet: how CPI, PPI, and PCE could steer risk
Investors commonly watch three U.S. inflation series—CPI, PPI, and PCE. Each matters differently for markets and the Fed.
Know your indicators
- CPI (BLS): Headline and core drive initial market reactions; shelter and services ex-energy are pivotal (BLS CPI).
- PPI: Feeds into goods disinflation and margins; large moves can foreshadow CPI trends.
- PCE (BEA): The Fed’s preferred gauge; watch core PCE and services ex-housing (BEA PCE).
Scenario map for the next prints
- Cooler-than-expected: Goods deflation persists, services ease, shelter decelerates. Odds of easier policy path rise; growth and small caps may catch a tailwind.
- Mixed: Goods cool but services sticky. Choppy trade with rotations; quality balance sheets and cash flow resilience favored.
- Hot: Services re-accelerate or shelter stays firm. The curve reprices tighter policy; high duration equities and speculative pockets feel the pinch.
Look beyond the headline. “Supercore” services and revisions can flip the narrative. Shelter components are lagged; turning points take time to filter through.
Pro tip: Read the prior-month revisions and seasonal adjustments. Markets often trade the delta from revised baselines—not just the fresh headline.
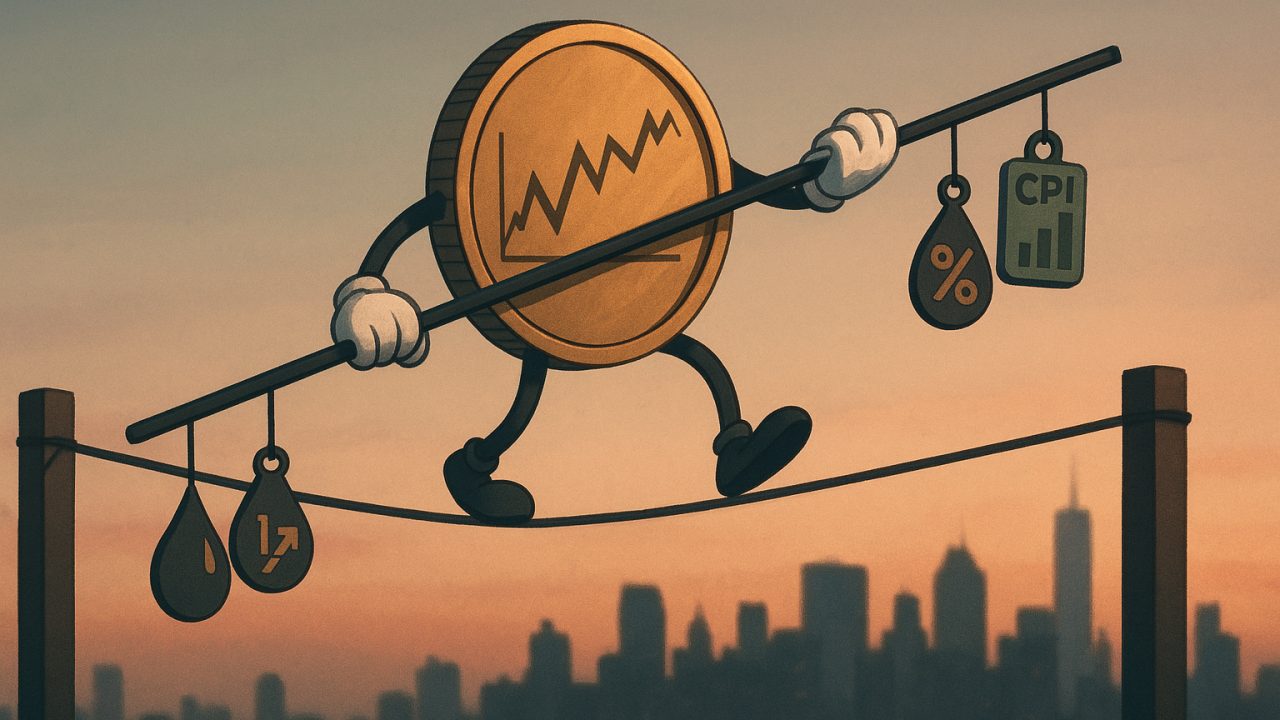
Under the hood: breadth, volatility, and positioning signals
When a rally stretches into multiple weeks, internals decide whether it’s sustainable or brittle.
- Breadth: Track advancing/declining issues and new highs vs new lows. Broad participation signals durability.
- Equal-weight vs cap-weight: If equal-weight indexes lag markedly, leadership concentration raises drawdown risk.
- Volatility regime: A low VIX can indicate calm or complacency; watch VIX term structure for stress (backwardation) or comfort (contango).
- Options positioning: Dealer gamma exposure can pin markets near key strikes; breaks beyond those levels unlock faster moves.
- Credit spreads: A widening in high yield or investment grade can precede equity weakness.
Mistakes to avoid:
- Buying breakouts when breadth is deteriorating and real yields are rising.
- Letting leverage creep higher in thin liquidity periods.
- Ignoring cross-asset warnings from the dollar and rates.
A practical game plan for the next two weeks
Use a rules-based approach to navigate the holiday reset and macro catalysts without overtrading.
- Define guardrails: Set maximum portfolio drawdown and single-position risk. If exceeded, cut to core positions.
- Stage entries and exits: Scale in around pre-identified support levels; scale out into strength rather than selling all at once.
- Hedge asymmetrically: Consider index put spreads, collars on concentrated winners, or rate hedges via Treasury ETFs. Size hedges to cover tail risk, not every wiggle.
- Favor balance sheets: Tilt toward companies with net cash or low refinancing needs if rates are volatile.
- Rotate selectively: If oil rises on demand strength, look to industrials and quality cyclicals; if oil spikes on supply shock, keep defensives and energy exposure balanced.
- Mind cash and T-bills: Holding dry powder can be a strategy when expected volatility rises; short-duration yield can offset equity risk.
- Calendar discipline: Note data days and options expiries; reduce gross exposure if you cannot monitor prints live.
Risk reminder: Options and leveraged ETFs carry elevated risk and may not suit all investors. Understand margin, decay, and assignment mechanics before using them.
If stocks sneeze, does crypto catch a cold? Cross-asset clues to watch
Crypto’s correlation with equities is regime-dependent. During liquidity shocks or rapid repricing of rates, correlations across risk assets often rise. In calmer conditions, crypto can decouple based on ecosystem-specific flows and narratives.
- Real yields and the dollar: Rising real yields and a stronger dollar have historically pressured risk assets, including major crypto assets, though not always to the same degree.
- Stablecoin supply: Expanding stablecoin float may reflect improving crypto-native liquidity, while contractions can coincide with risk-off phases.
- Funding and basis: Elevated perp funding or wide futures basis can signal crowded longs vulnerable to shakeouts if equities wobble.
- Regulatory headlines: Crypto can move on policy news independent of equities; watch official statements from major jurisdictions.
For diversified portfolios, avoid assuming crypto will always hedge equities. Stress periods often compress diversification benefits. Position sizing, not presumed negative correlation, is the first line of defense.
Catalyst checklist investors can run each morning
Build a quick daily ritual to avoid being blindsided when liquidity is thin.
- Energy calendar: Scan for OPEC+ meetings and the weekly U.S. inventory report from the EIA.
- Macro data: CPI and PPI (BLS), PCE (BEA), PMIs/ISM, retail sales, and payrolls can all shift the rates narrative within minutes (BLS, BEA).
- Fed and central banks: Monitor the FOMC calendar and speeches for guidance on policy balance-of-risks (FOMC).
- Treasury supply: Note auction sizes and refunding announcements that can nudge term premia (U.S. Treasury).
- Earnings and guidance: Preannouncements from bellwethers can reset expectations faster than macro data.
- Options landscape: Check key strikes and gamma exposure around major expiry dates; respect potential pinning or air pockets.
If you want concise, cross-asset context that blends equities, macro, and digital assets, you can find more market coverage at Crypto Daily.
Frequently Asked Questions
Does a holiday period usually help or hurt the S&P 500?
Seasonality can be modestly supportive in some holiday windows, but thin liquidity makes outcomes path-dependent. Small surprises in oil, rates, or data can create outsized moves. Treat holiday weeks as higher gap-risk periods rather than reliably bullish or bearish.
Is rising oil always bad for the index?
Not necessarily. Gradual oil gains tied to solid demand can coexist with rising equities. Rapid spikes driven by supply shocks tend to tighten financial conditions and pressure margins. The speed and cause of the move matter more than a specific price level.
Which yield matters most for this rally: 2-year, 10-year, or real yields?
All three matter, but equity multiples are especially sensitive to the 10-year and to real yields. The 2-year steers policy expectations; if it reprices toward tighter policy, equities often react swiftly.
How could a “soft” CPI still unsettle markets?
Revisions, sticky services components, or an uptick in supercore can offset a friendly headline. Markets may also react to composition effects—e.g., goods deflation with firm services—and to implications for the Fed’s preferred PCE measure.
What signals suggest the eight-week rally is tiring?
Narrowing breadth (equal-weight underperformance), rising real yields, widening credit spreads, and failed breakouts on higher volume are common signs. Watch for failed retests of prior highs and leadership confined to a handful of megacaps.
How can I hedge tactically into inflation and rate events?
Consider defined-risk option structures like put spreads on broad indices, collars on concentrated winners, or modest duration hedges via Treasury ETFs. Size hedges to your downside tolerance and be mindful of event timing and implied volatility.
Will crypto diversify equity risk if the S&P 500 stumbles?
Sometimes, but not reliably. In stress, correlations across risk assets often rise. Monitor real yields, the dollar, and stablecoin flows. Diversification should start with position sizing and liquidity planning rather than assuming negative correlation.
Disclaimer: This article is provided for informational purposes only. It is not offered or intended to be used as legal, tax, investment, financial, or other advice.





Be the first to comment