



Stellar is sitting on one of those charts that stay quiet for years — until the structure forces people to look again.
According to mainstream trader TakeProfitNow, XLM has repeatedly returned to the same broad liquidity zone since 2019, and price is back there now. On the weekly chart, that base is marked as a major demand area that has absorbed multiple multi-year tests without giving way for good.
Sponsored
Crypto Prediction Markets

18+ · Gambling involves risk. Play responsibly.
Above it, a long-term rising trendline projects toward the $2+ region. From current levels near $0.22, that path is being framed as roughly a +7,000% move if the larger structure plays out.
Why this zone keeps mattering
The argument is less about a short-term scalp and more about market memory.
When an asset revisits the same major liquidity pool across cycles, technicians watch for whether buyers still defend it. XLM’s chart shows several historical reactions from that lower band, which is why the latest retest is getting attention again.
The upside map is intentionally aggressive. A trendline pointing toward $2+ is a cycle-scale objective, not a next-week target. That is also why the post leans into the “sounds ridiculous” framing — major crypto expansions often look unrealistic from the base that launches them.
What XLM bulls still got to prove
A liquidity-zone bounce is only the first condition. For the long-term trend-line case to gain traction, XLM would need sustained acceptance higher, stronger market participation, and a broader risk-on backdrop.
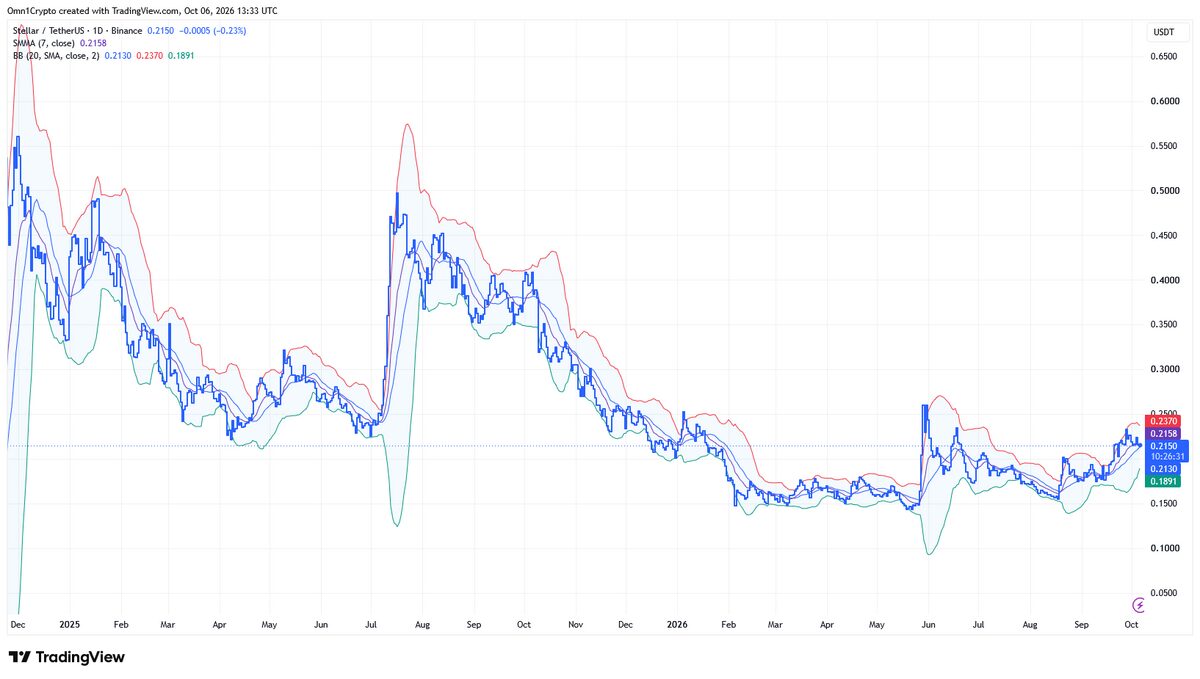
The smaller time-frame charts point to $0.235 as the next level to break in the near-term, as the broader market carries on moving sideways on Tuesday. In other words, the XLM price setup is getting interesting because the level is familiar in previous bullish setups.
It’s not ratified just because the price is back up in that range.
Discover DailyCoin’s trending crypto scoops today:
Altseason Builds: XRP, ADA & SOL Enter Rotation Zone
OKX, ICE Plan 24/7 Trading for Tokenized U.S. Stocks





Be the first to comment