


What to know:
- Stellar (XLM) is testing a key breakout zone after months of downward pressure.
- LSTRADER remains cautious, saying a confirmed reversal has not yet appeared despite improving chart structure.
- Crypto Patel believes Stellar’s long-term cycle could support a move toward much higher levels if major resistance breaks.

Stellar (XLM) is showing early signs of recovery after spending months under pressure, with recent price action drawing attention from market watchers tracking potential trend changes.
While broader altcoin markets remain mixed, traders continue to monitor whether XLM can build enough strength to confirm a sustained move higher.
Recently, LSTRADER has issued warnings regarding the Stellar price, indicating that although several alternative cryptocurrencies have held their positions well, there are no signs yet of any major reversal taking place on an overall market basis.

As per LSTRADER, patience would be the wisest strategy at this juncture, with better odds expected in due course.


Source: X
Also Read: Hyperliquid Price Crashes to $56: Is HYPE’s Rally Over or Just Pausing?
Stellar Price Tests Breakout Zone After Long Decline
According to the recent XLM/USDT chart, the Stellar price appears to be seeking to escape the long-term trendline in which its price movement has been confined. Throughout the decline, the asset has been forming lower tops and lower bottoms, thus remaining in XLM’s control.
The Stellar price created a rounded bottom formation around $0.185, indicating lower levels of selling pressure and increased buying interest. The Stellar price crossed above the descending trend line and currently challenges the $0.20 to $0.205 region as support.
This support may act as an ideal validation for the breakout pattern. According to the chart, there could be a consolidation phase with targets around $0.23 and potentially moving towards $0.24-$0.26.
Long-Term Pattern Fuels Higher Price Expectations
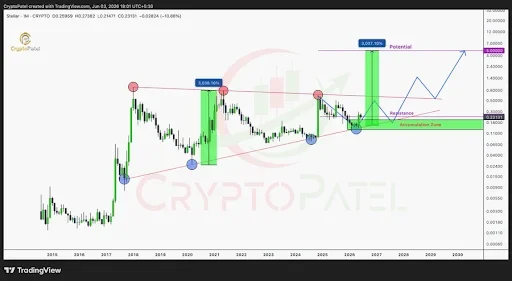
About a week ago, Crypto Patel highlighted a large-scale, years-long pattern that he believes will determine the next major move in the Stellar price.
From the monthly chart below, we can observe that there is a long-term symmetrical triangle pattern being formed. It can be seen that the Stellar price experienced very large rallies following prolonged accumulation phases during the 2017/2018 cycle and 2020/2021 cycles.
The price action brought gains close to 3,000%, thus creating what many traders consider will be a pattern replicated, provided current levels hold.

Source: X
The significant support level is in the range of $0.18 to $0.25, as buyers have shown their presence in this price range before.
The important resistance level stands at $0.30, and a breakout above it would increase the bullish pressure. However, the Stellar price in the future is subject to the overall market sentiment.
This article contains market analysis and price predictions. These are not guarantees. Crypto markets are volatile. Always DYOR. Not financial advice.
Also Read: Binance Coin Price Holds $570 as Resistance Triggers Market Uncertainty

Be the first to comment