


What to know:
- SUI reclaimed the $1 level, surging 6.18% to $1.03 amid rising buying interest and strong $872.04M trading volume.
- Technical setup suggests a potential reversal, supported by Fibonacci levels, trendline bounce, and short-term profit-taking above 25%.
- Indicators are turning bullish, with RSI at 62.87 and MACD showing early positive momentum above the signal line.

SUI regained the level of $1 as increased buying interest emerged along with a favorable chart formation that implied a potential reversal of fortune. Following its recent downturn, it is being assessed whether or not the rebound will form an upward trend.
At the time of writing, SUI is trading at $1.02, recording a 4.27% gain over the last 24 hours. Daily trading activity remains strong, with volume reaching $872.04 million, while its market capitalization stands at approximately $4.09 billion.


Source: CoinMarketCap

Also Read | CEX Trading Plunges 39% in Q1 as CoinGecko Warns of Brutal Crypto Winter
SUI Rally Builds Toward Higher Targets
Crypto analyst Crypto Patel shared his analysis on X, stating that SUI had reclaimed the $1 level in line with a previously identified fractal. The pattern was first identified during a period of negative sentiment.
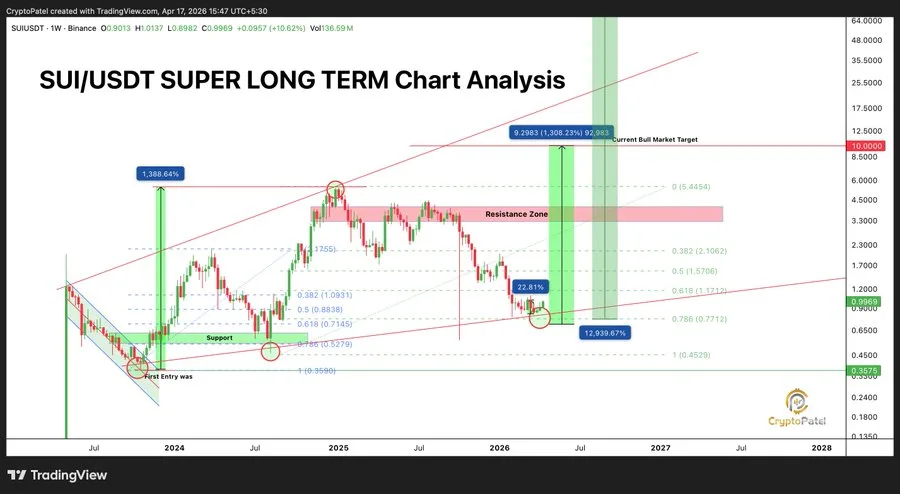

Source: Crypto Patel’s X Post
The analysis shows that there are several technological factors that confirm the move. In particular, the 0.786 Fibonacci level has been holding strong, whereas an impulse from a long-term trend line bounce has helped the market advance higher. Short-term investors are already taking profits of more than 25%.
For future considerations, the analyst proposed possible price levels of $2, $5, $10, and $20 if the bull trend persists. Nevertheless, such forecasts remain hypothetical and rely on the historical fractal that emerged in 2024 and provided profits exceeding 1000%.
SUI Technicals Confirm Uptrend Bias
From the technical perspective, the signals start showing a bias towards the bulls. The RSI is now at the level of 62.87, meaning that it is above the neutral level and suggesting that there is growing pressure on the buyers’ side. Simultaneously, SUI is now trading above its short-term MA ribbon, with support at $0.91–$0.93.
However, the overall trend is still developing. Higher levels of moving averages around $1.10 still present the resistance barrier, showing that the market has not yet confirmed the sustainable long-term upward trend.

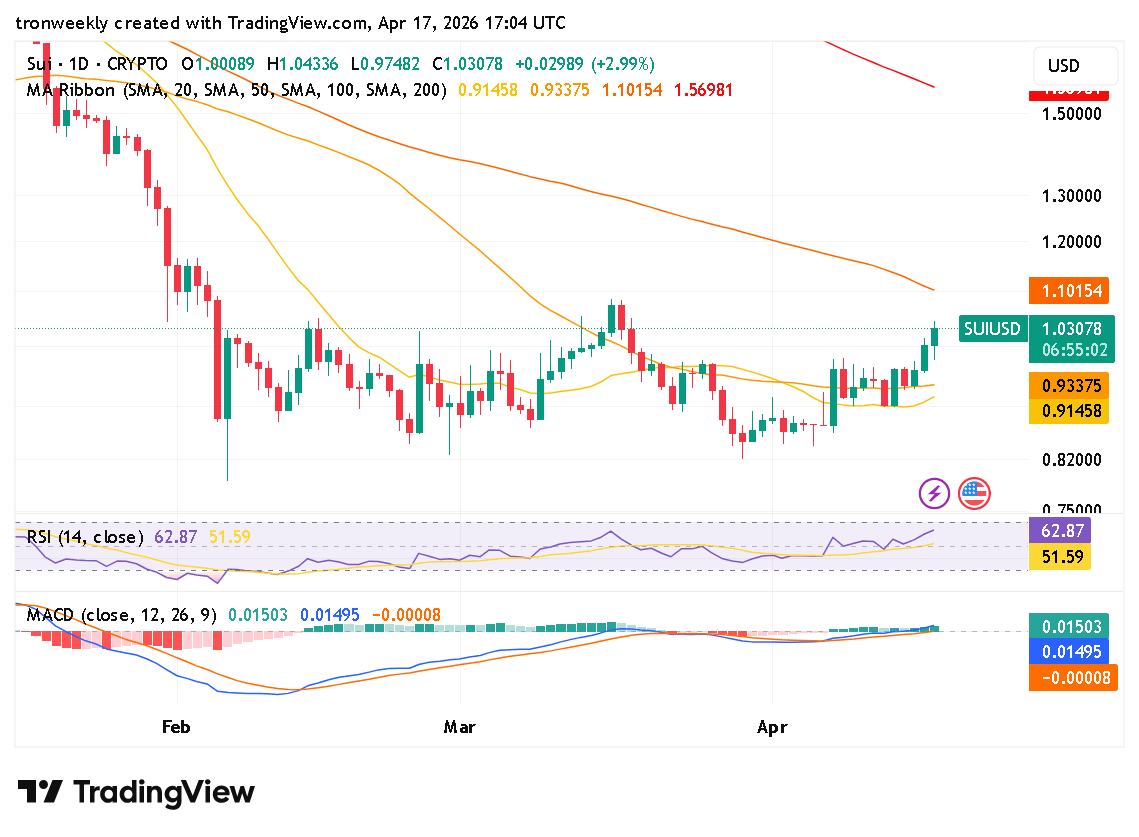
Source: TradingView
Momentum indicators have shown an improvement as well. The MACD has gone a little positive, as the MACD line now holds above the signal line. The histogram has also gone to a positive zone, indicating increasing momentum to the upside.
Overall, it looks like SUI is at the initial stages of a possible revival. Although the signs that have emerged now show improvement in strength, more evidence would be needed to confirm a breakout.
This article contains market analysis and price predictions. These are not guarantees. Crypto markets are volatile. Always DYOR. Not financial advice.
Also Read | US Government Moves 8.2 BTC to Coinbase Prime Sparks Market Speculation

Be the first to comment